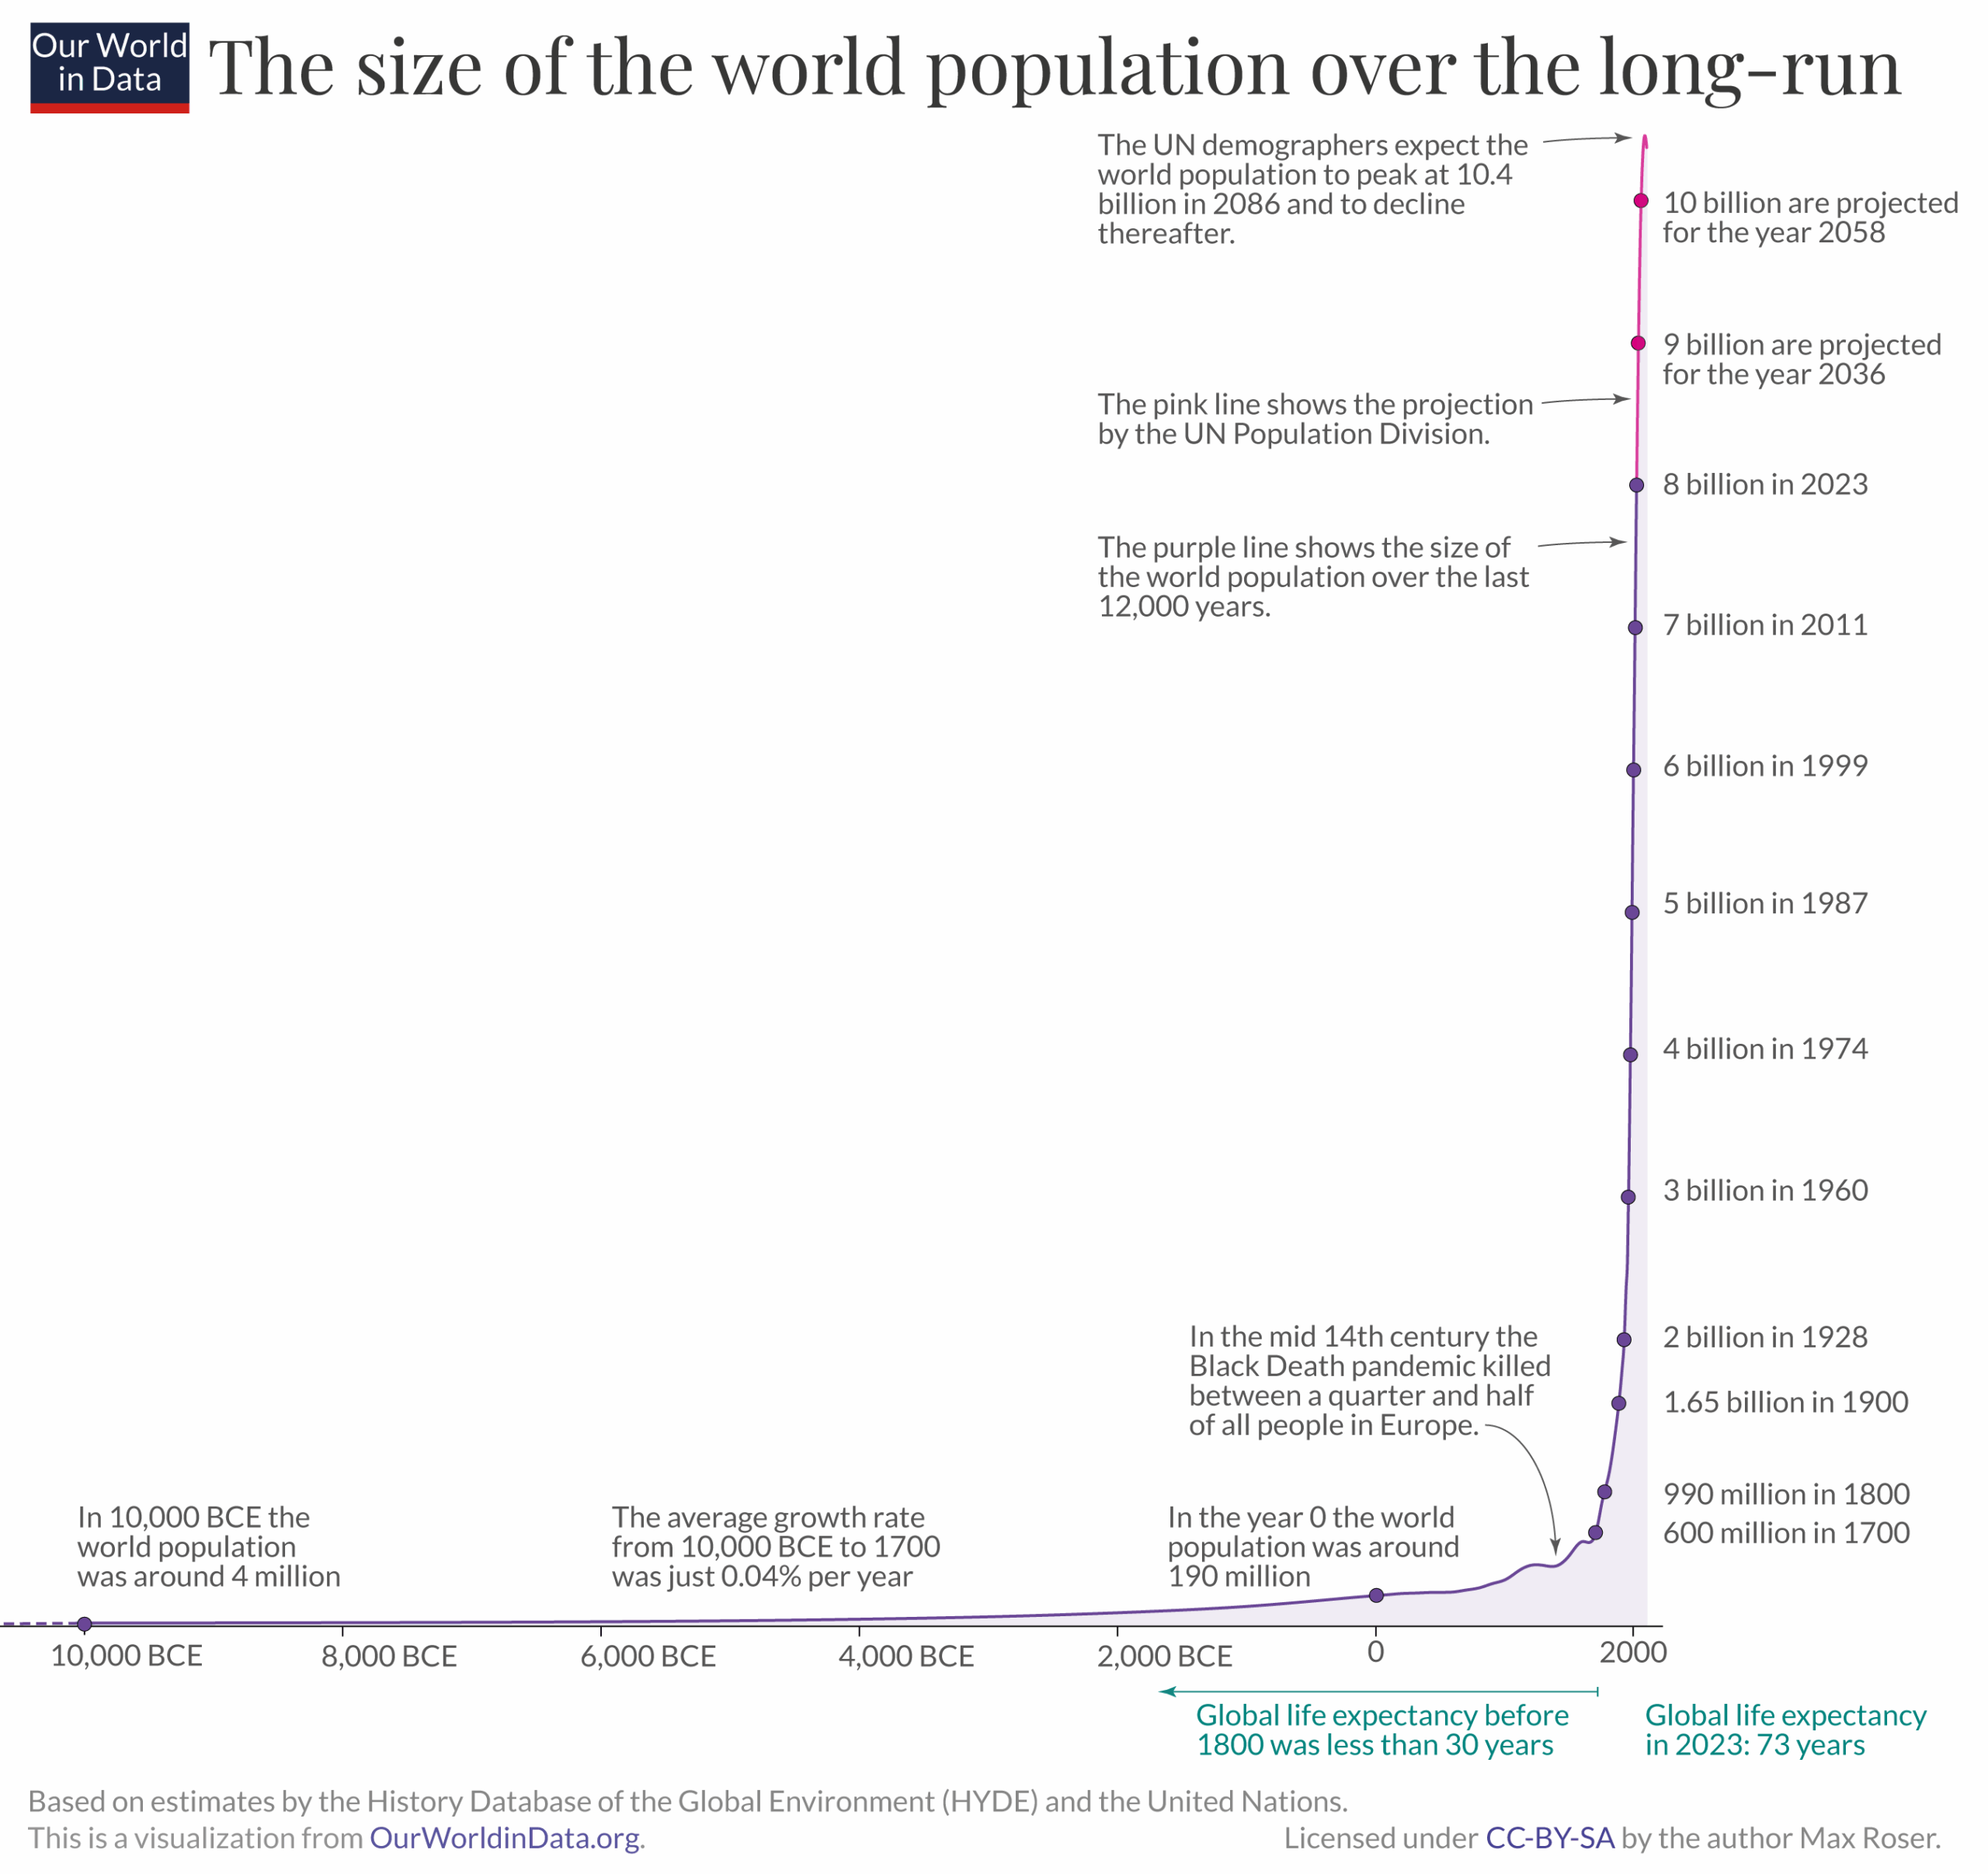
The world population has changed dramatically over the last few centuries. Let’s examine long-run population data to understand this change and how quickly the world’s population is growing today.
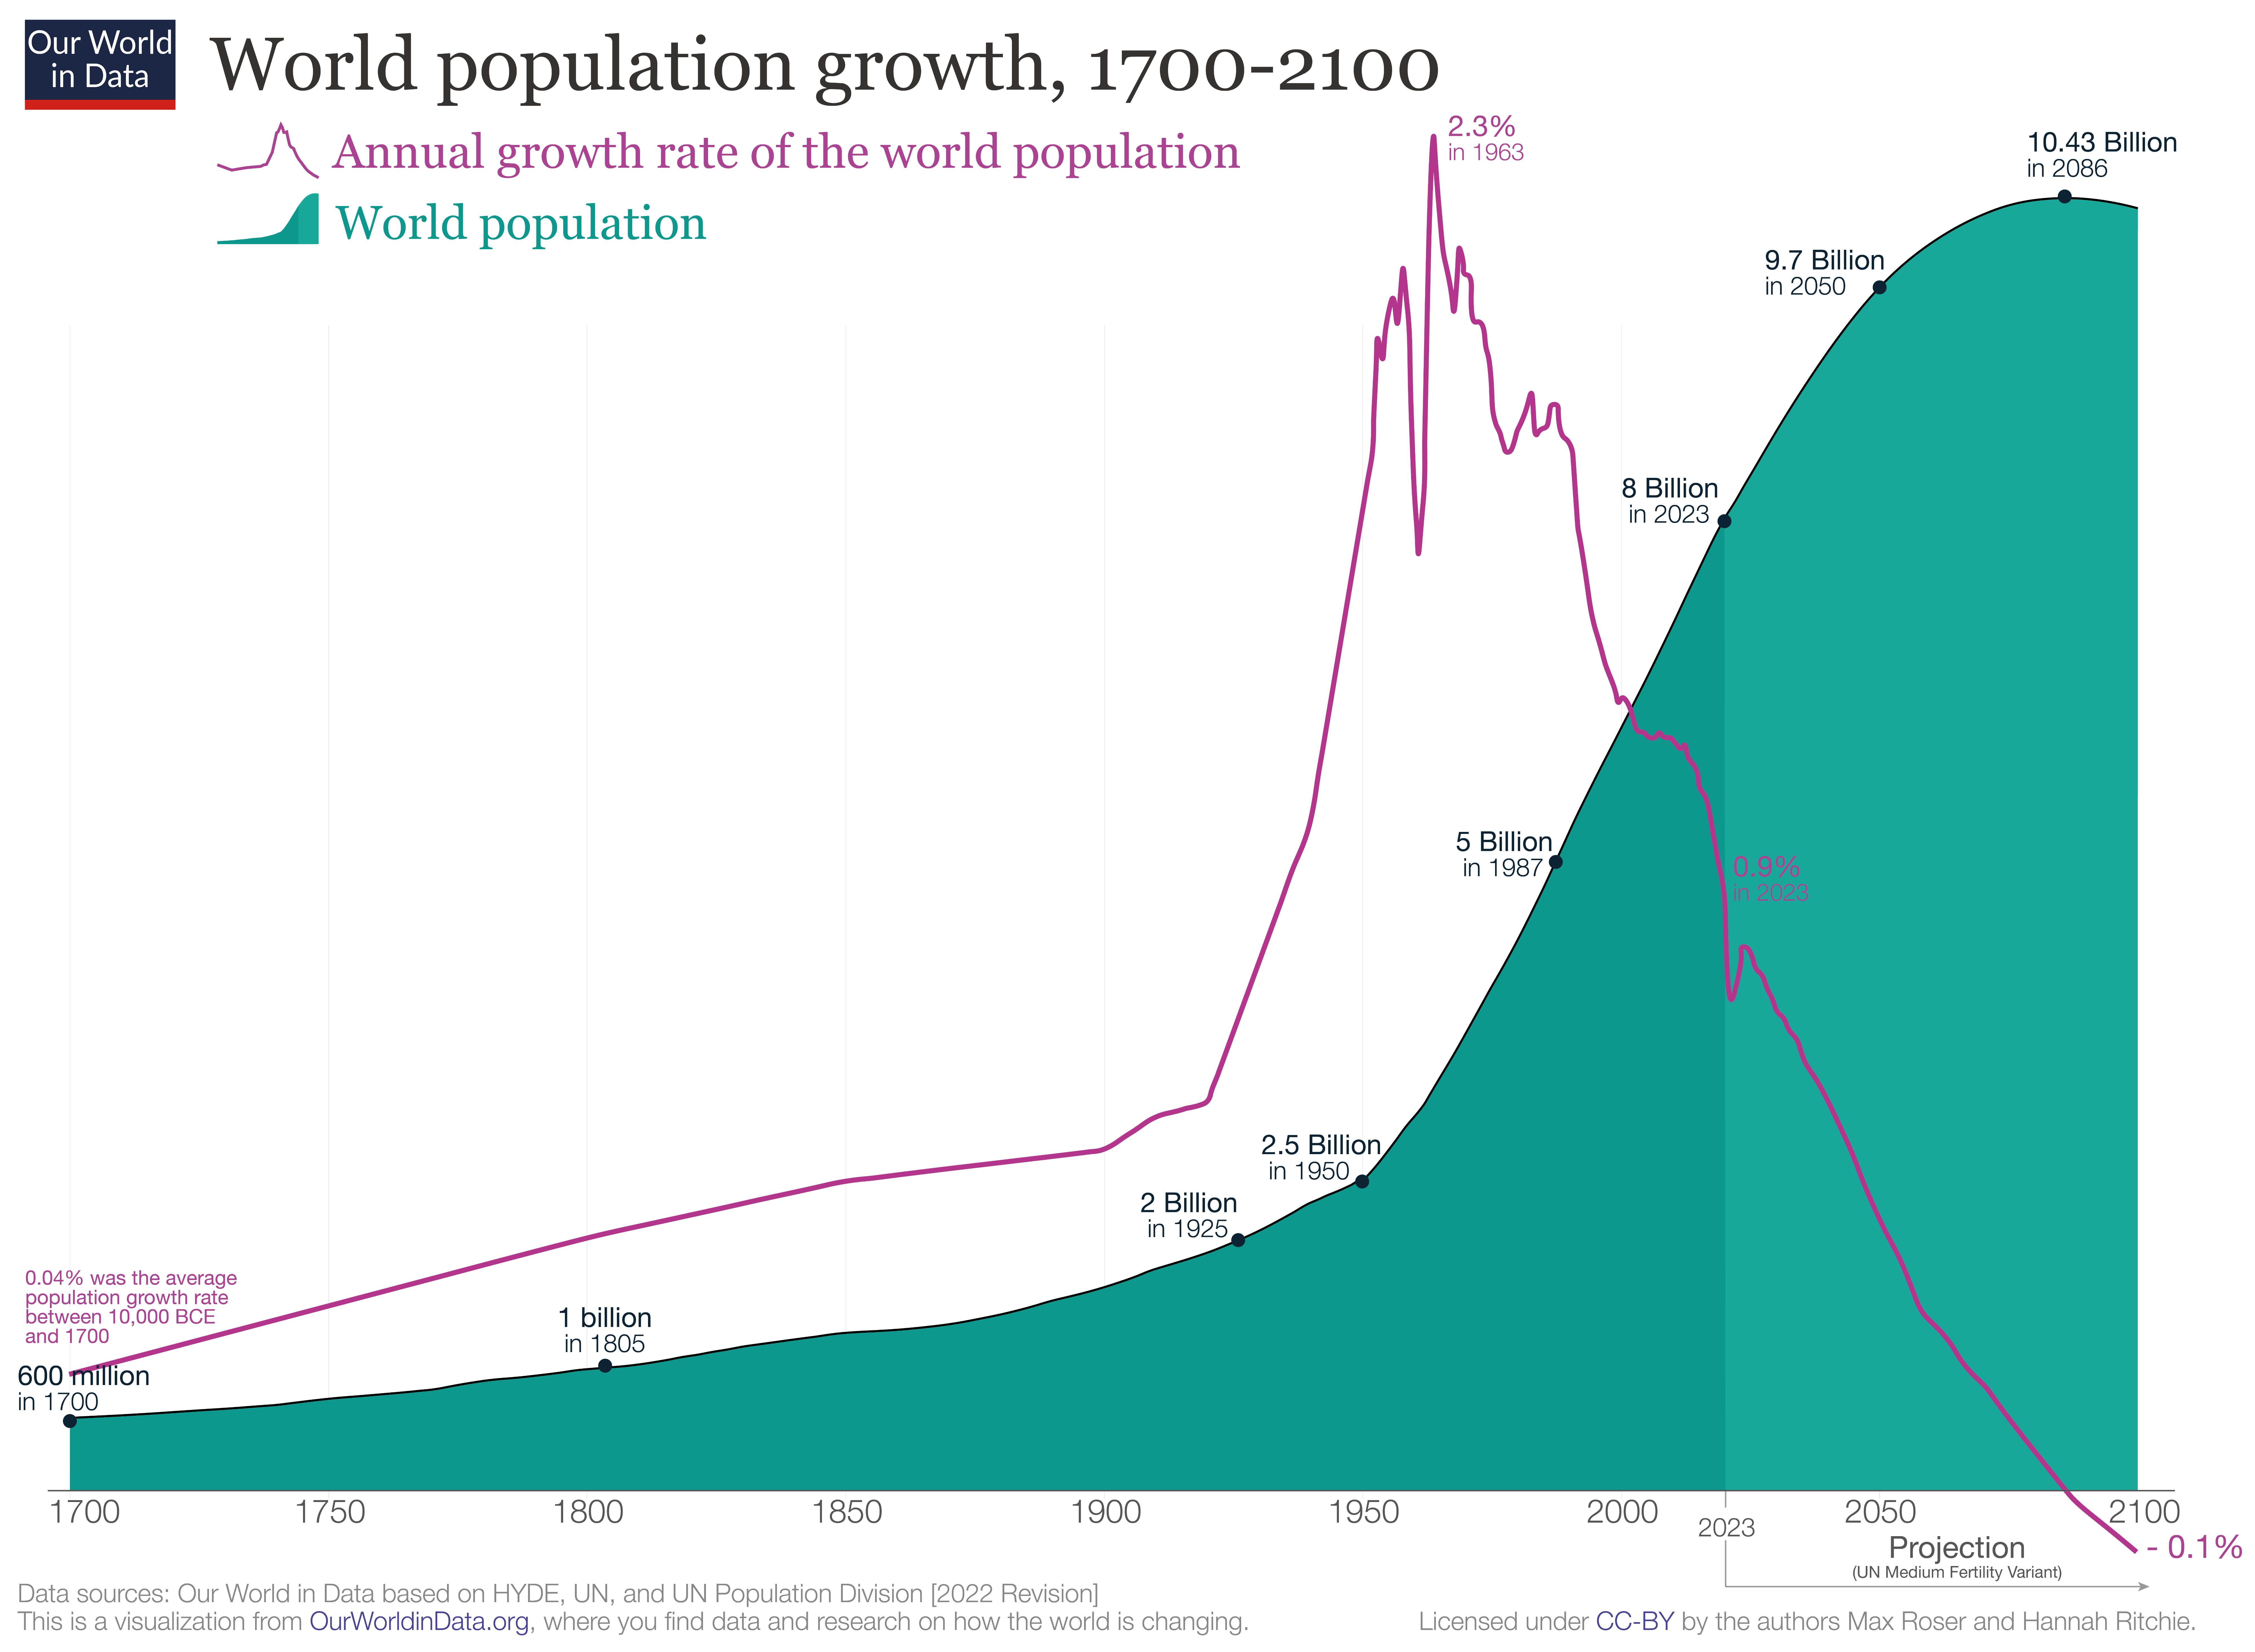
The global population growth rate peaked long ago. The chart shows that global population growth peaked in 1962 and 1963 with an annual growth rate of 2.2%; however, since then, world population growth has halved.
For the last half-century, the population growth rate has been declining. The UN projects that this decline will continue in the coming decades.
A common question we’re asked is: is the global population growing exponentially? The answer is no.
Population growth is determined by births and deaths. Every country has seen very substantial changes in both: mortality and fertility rates have fallen across the world.
However, declining mortality rates and declining fertility rates alone do not explain why populations grow. If these changes happened at the same time, the size of the population would not increase. What is crucial is the timing at which mortality and fertility change.
The model that explains why countries go through a period of rapid population growth is called the ‘demographic transition’. It is shown in the schematic figure. It is a beautifully simple model that describes the observed pattern in countries worldwide and is one of the great insights of demography.
Source 1: https://ourworldindata.org/population-growth-over-time
Source 2: https://ourworldindata.org/demographic-transition