Olympic Games Statistics
Olympic sports & events by edition (since 1960)
Sports on programme & events available per edition — hover a point for details · click legend to toggle
Sources: IOC / olympics.com. “Sports” = distinct disciplines on the programme. Gold medals = number of events contested. Some disciplines were added or removed between editions.
Olympic Games total cost by edition (2026 USD)
Total reported expenditure adjusted to 2026 dollar value — hover a bar for details
Sources: Oxford Saïd Business School (Flyvbjerg et al., 2016 & 2021); IOC; host city reports. Costs = total OCOG + public infrastructure spending where reported. Adjusted to 2026 USD using US CPI. Budget overrun = final vs. original bid estimate. * = estimated / partially reported. 2026 Milan-Cortina: projected.
Weighted olympic medals as % of events (since 1960)
Score = (gold×3 + silver×2 + bronze×1) / (events×3) × 100 — hover a point for details · click legend to toggle
Sources: IOC / olympics.com. Score = (gold×3 + silver×2 + bronze×1) / (events×3) × 100. Russia: USSR (1960–1988), Unified Team (1992), Russia/ROC thereafter. East Germany (GDR) listed separately 1968–1988. EU: 27 current member states.
Weighted Olympic medals per million inhabitants (since 1960)
Score = (gold×3 + silver×2 + bronze×1) ÷ population (M) — hover a point for details · click legend to toggle
Score = gold×3 + silver×2 + bronze×1, divided by population (M). EU total = exact sum of per-country scores. Countries also appearing as standalone series (Germany, Hungary, etc.) use identical G/S/B data in both the EU breakdown and their own line. Russia: USSR→Russia.
Weighted Olympic medals per $1 trillion GDP (since 1960)
Score = (gold×3 + silver×2 + bronze×1) / GDP ($T, 2026 USD) — hover a point for details · click legend to toggle
Sources: IOC / olympics.com (medals); World Bank / IMF (GDP, nominal USD deflated to 2026 USD using US CPI). Score = gold×3 + silver×2 + bronze×1. EU: 27 current member states combined GDP. Russia: USSR before 1992.
What If History’s Greatest Figures Had Taken the Insights Test?
Behavioural Analysis
Insights Discovery
Estimated profiles — Based on public behaviour and documented sources — Not certified by Insights®
Blue
Green
Yellow
Red
Natural (solid)
Adapted (transparent)
These profiles are analytical estimates based on public behaviour, biographies and documented sources.
They do not constitute certified Insights Discovery® assessments. Insights Discovery® is a registered trademark of The Insights Group Ltd.
They do not constitute certified Insights Discovery® assessments. Insights Discovery® is a registered trademark of The Insights Group Ltd.
Sports de Raquette | Classement par difficulté technique

English version








Les lois bibliques illégales ou immorales au 21ème siècle
La Bible, texte fondateur du judaïsme et du christianisme, contient des centaines de lois, de préceptes et de récits qui reflètent les normes sociales, religieuses et juridiques de l’Antiquité. Certaines de ces règles, si elles étaient appliquées littéralement aujourd’hui, seraient non seulement contraires aux valeurs démocratiques modernes (égalité, droits humains, liberté individuelle), mais aussi illégales selon les lois internationales et nationales.
World Population Growth | OurWorldInData.org
The world population has changed dramatically over the last few centuries. Let’s examine long-run population data to understand this change and how quickly the world’s population is growing today.
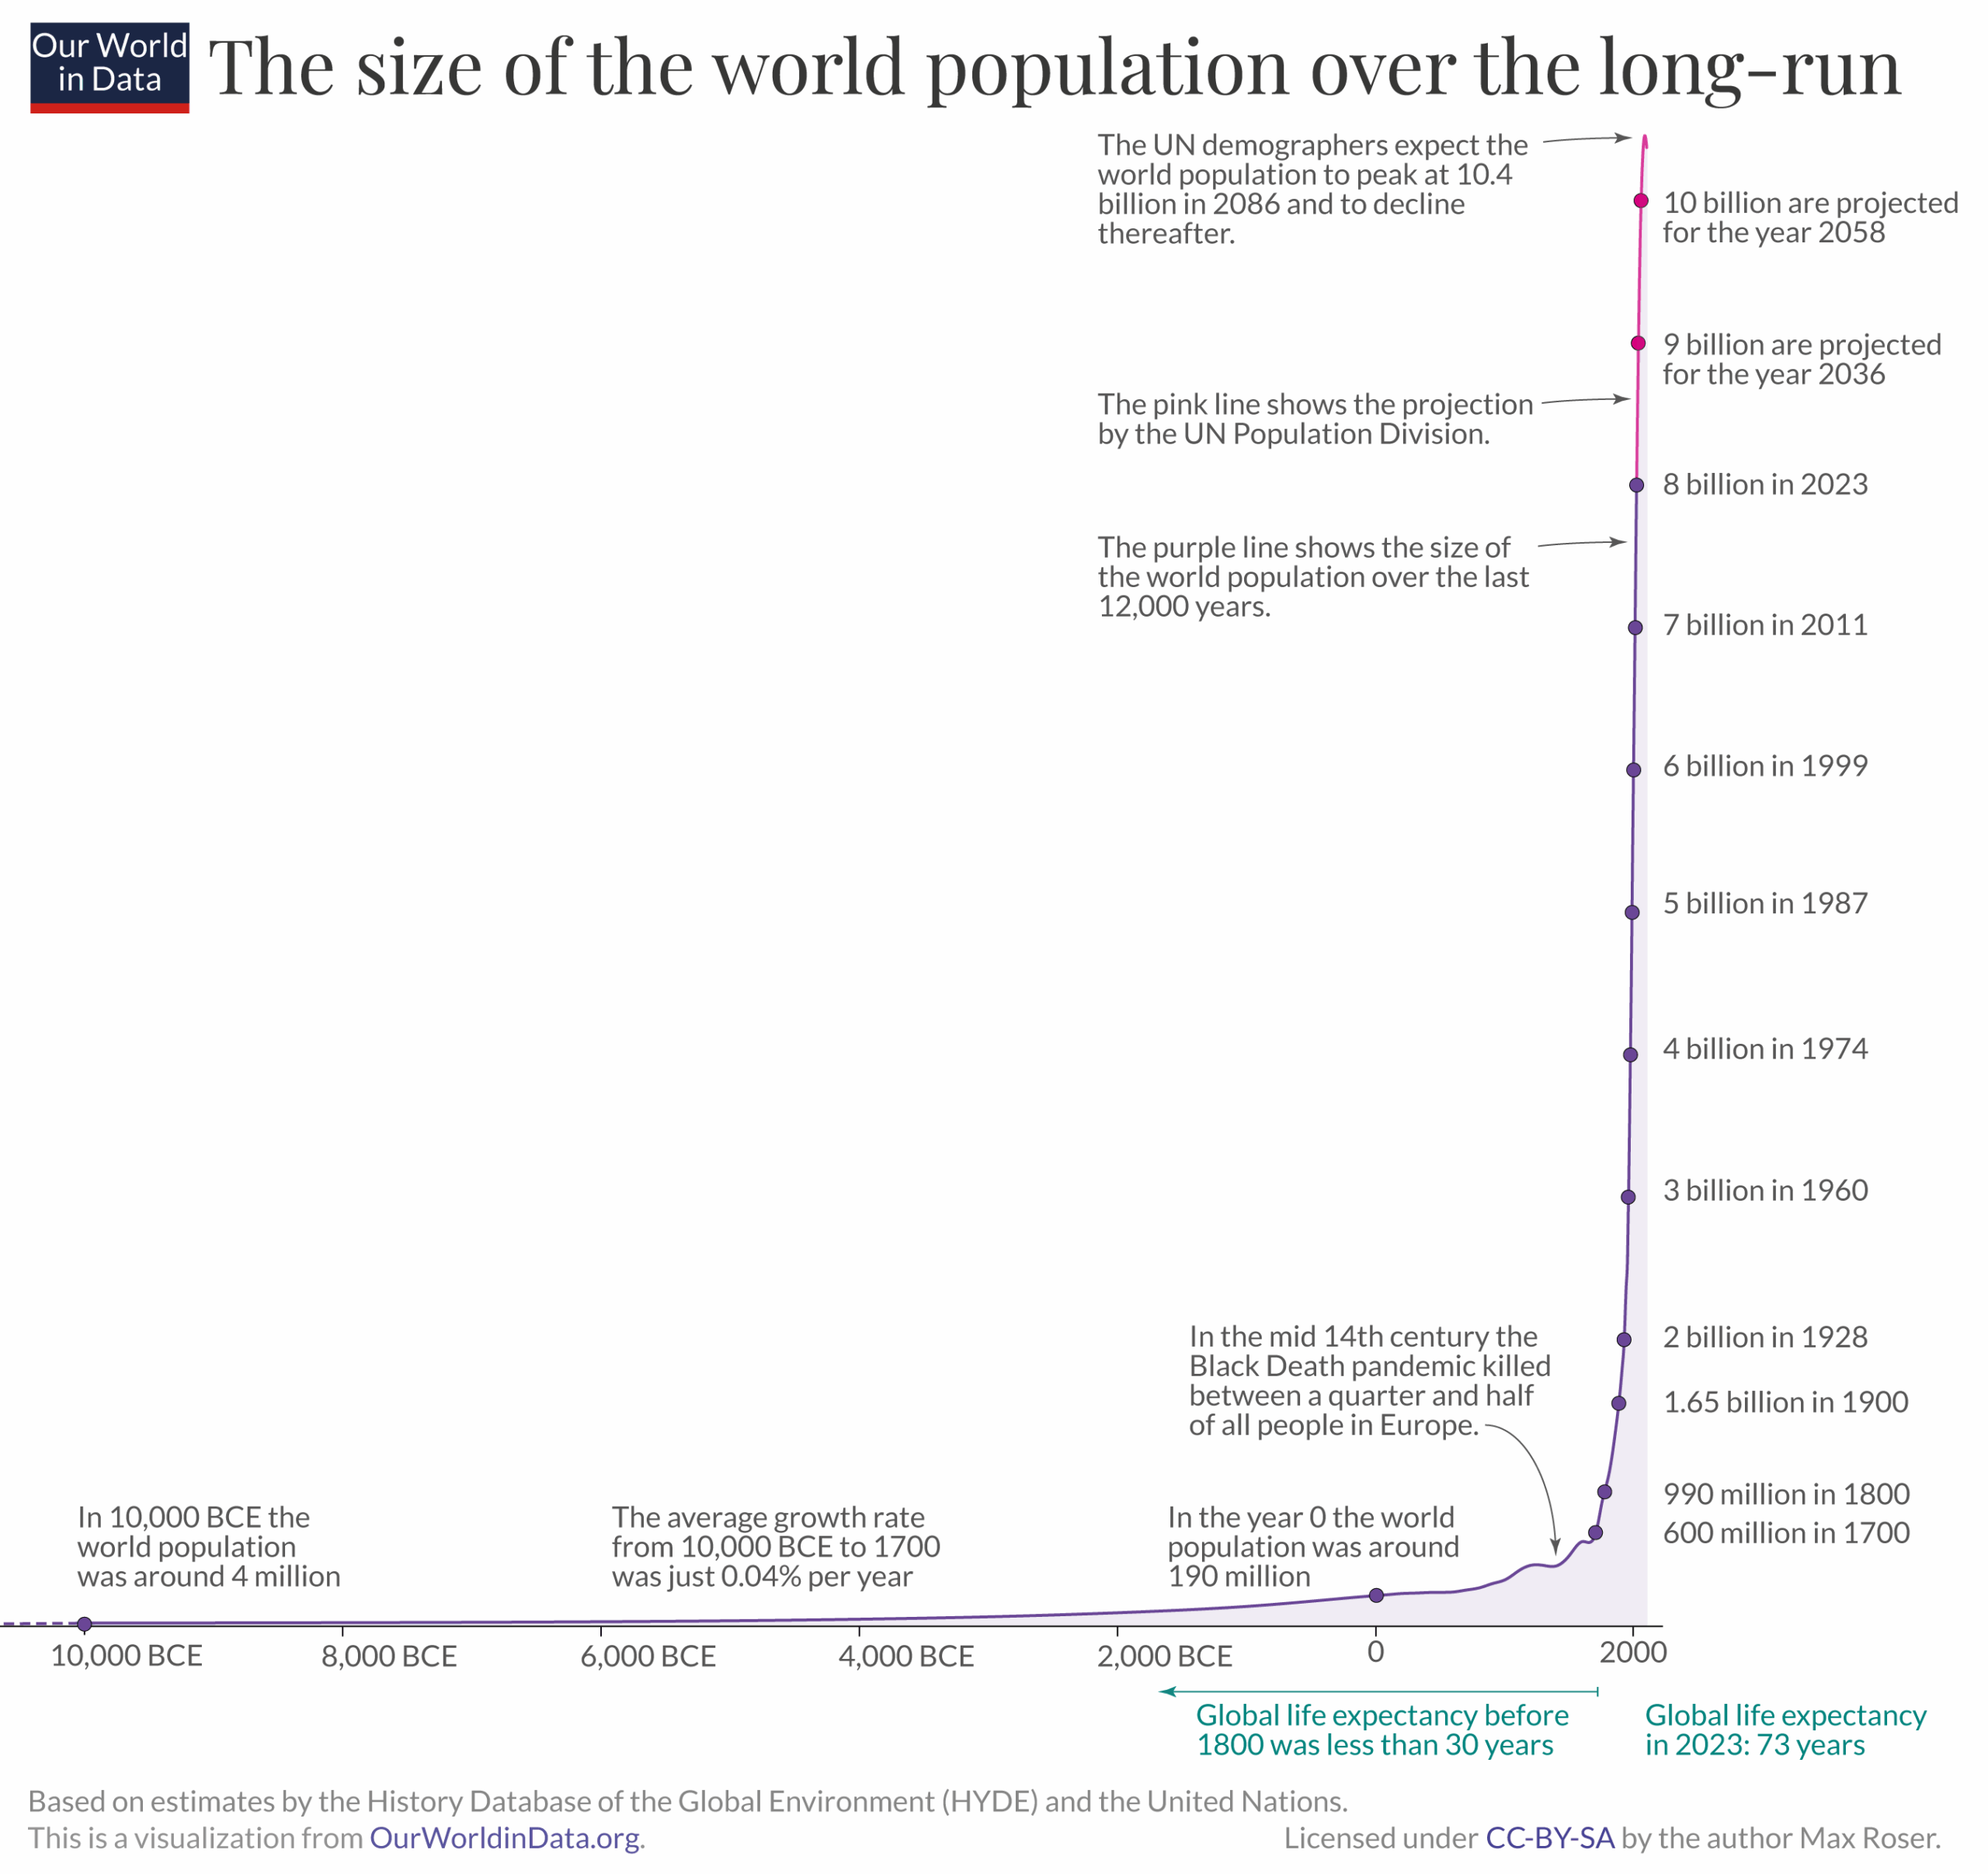
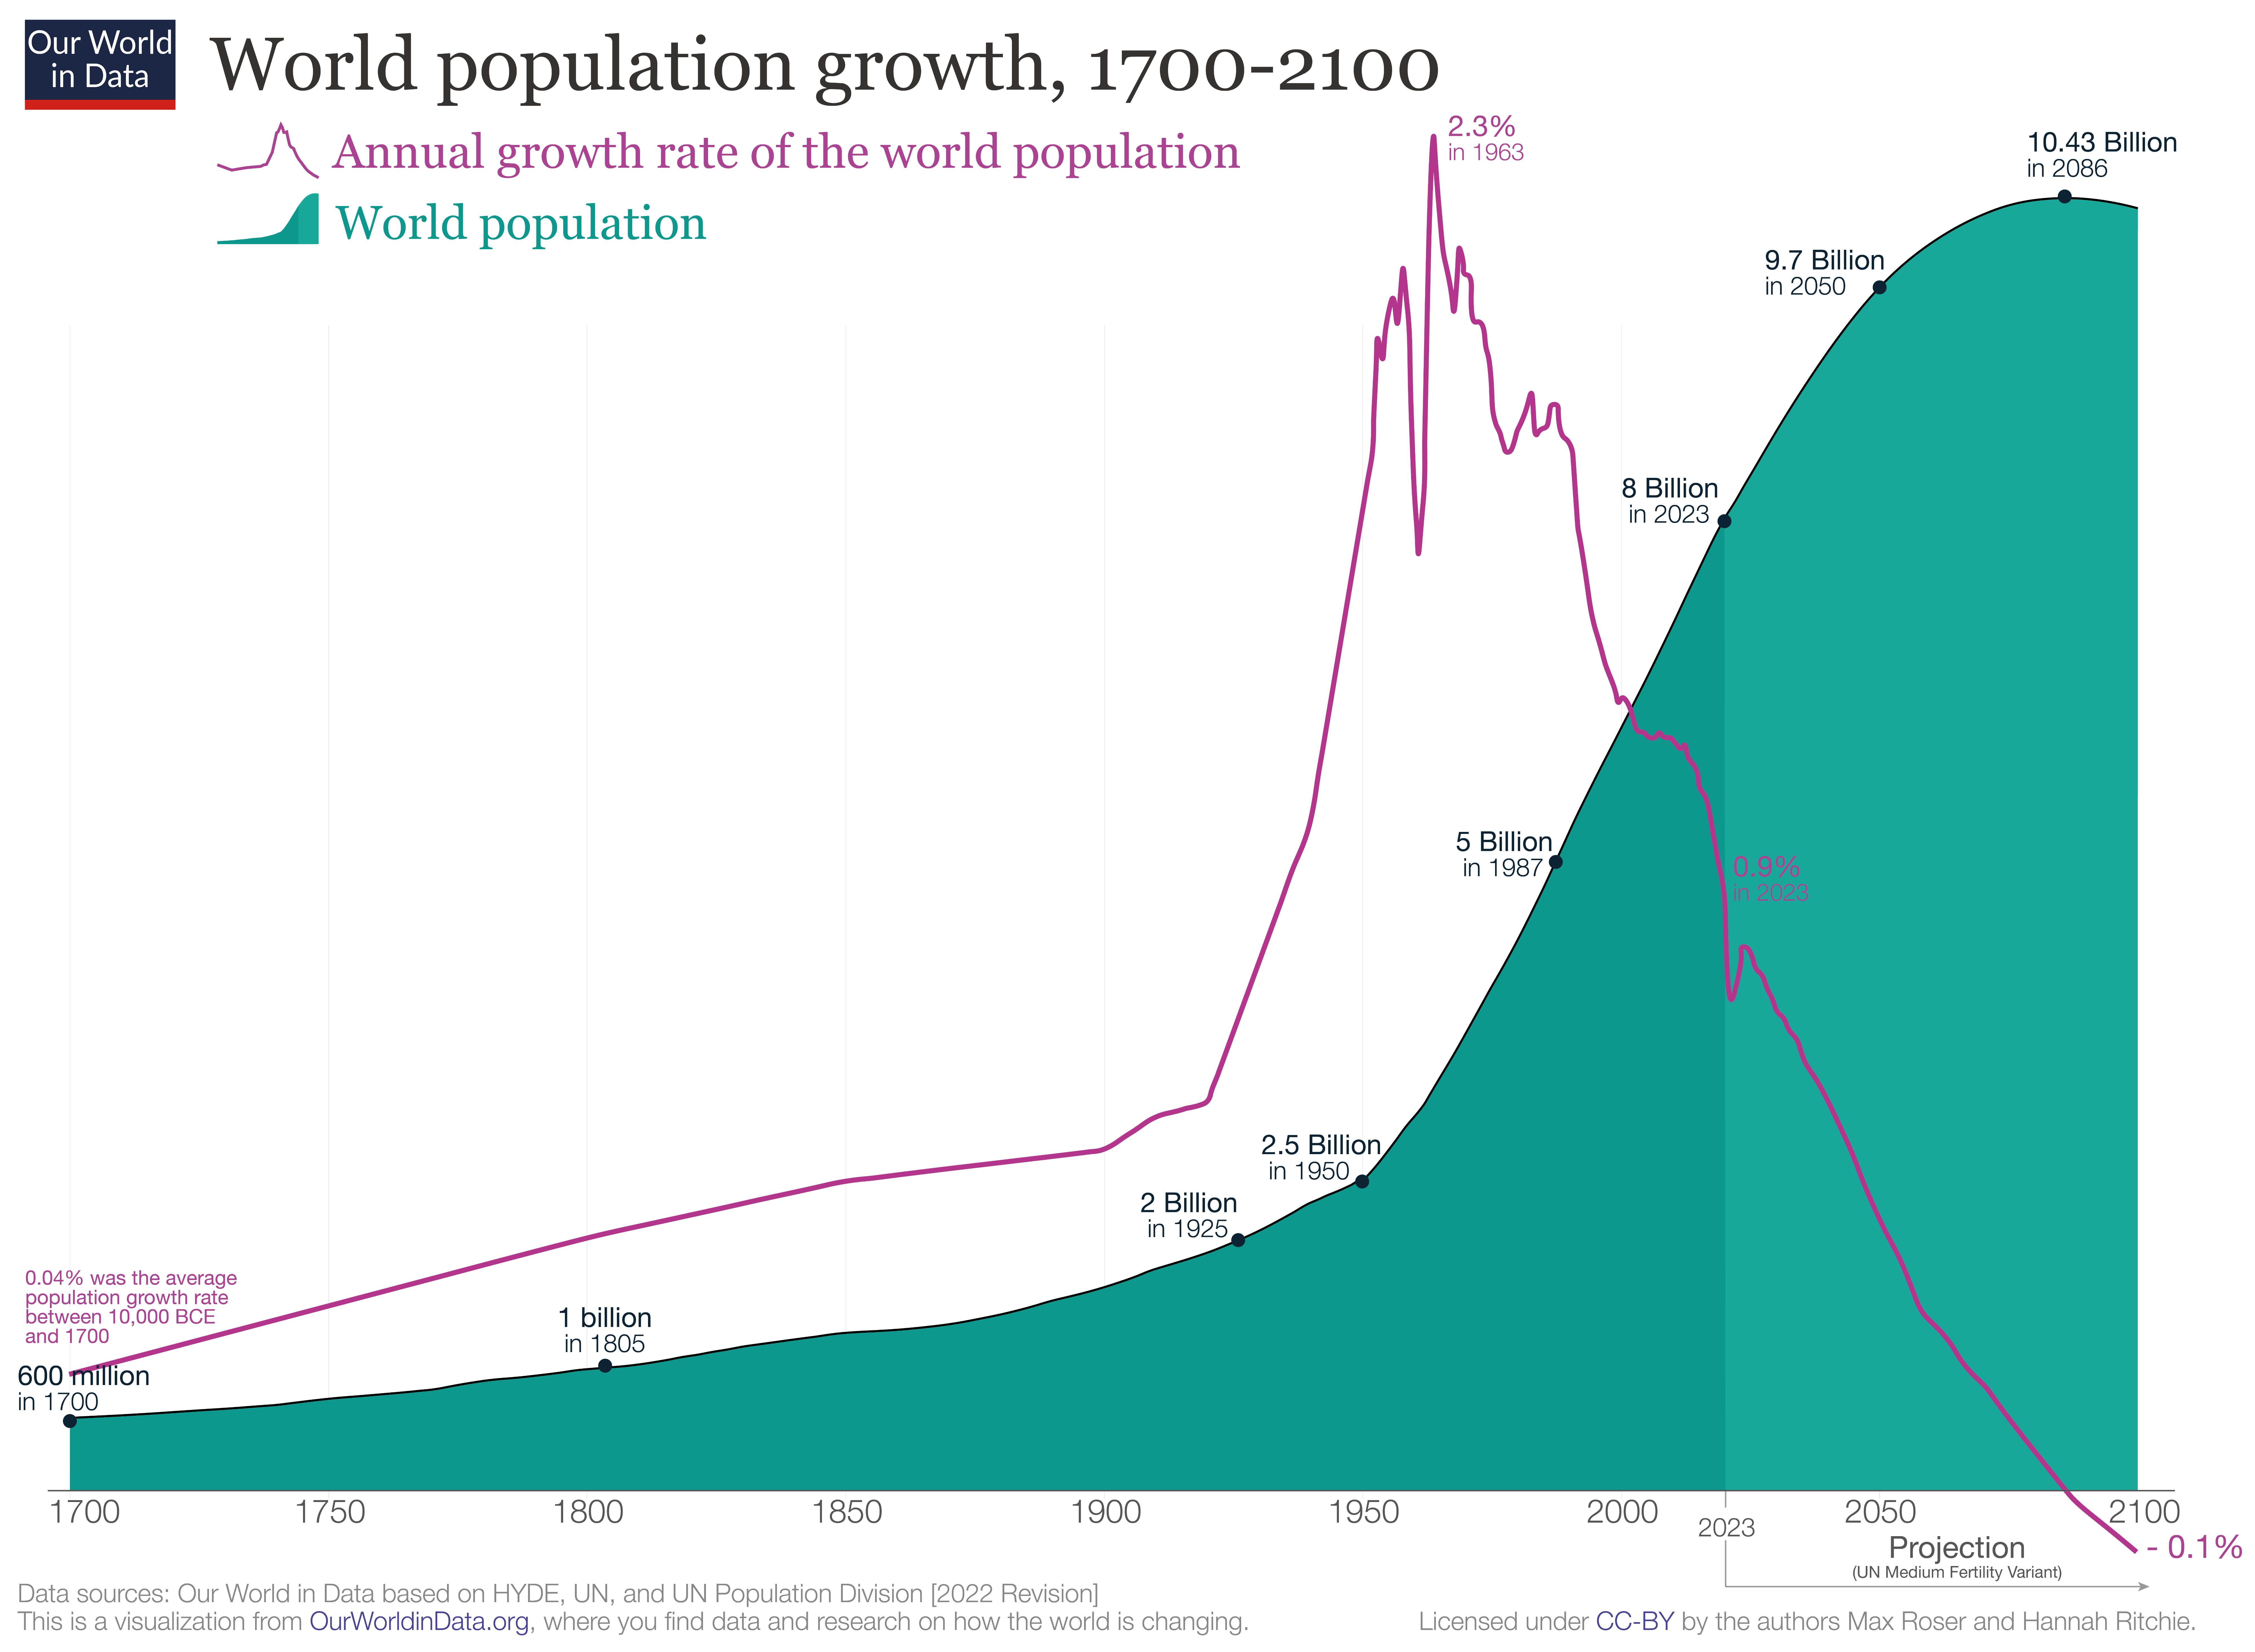
The global population growth rate peaked long ago. The chart shows that global population growth peaked in 1962 and 1963 with an annual growth rate of 2.2%; however, since then, world population growth has halved.
For the last half-century, the population growth rate has been declining. The UN projects that this decline will continue in the coming decades.
A common question we’re asked is: is the global population growing exponentially? The answer is no.
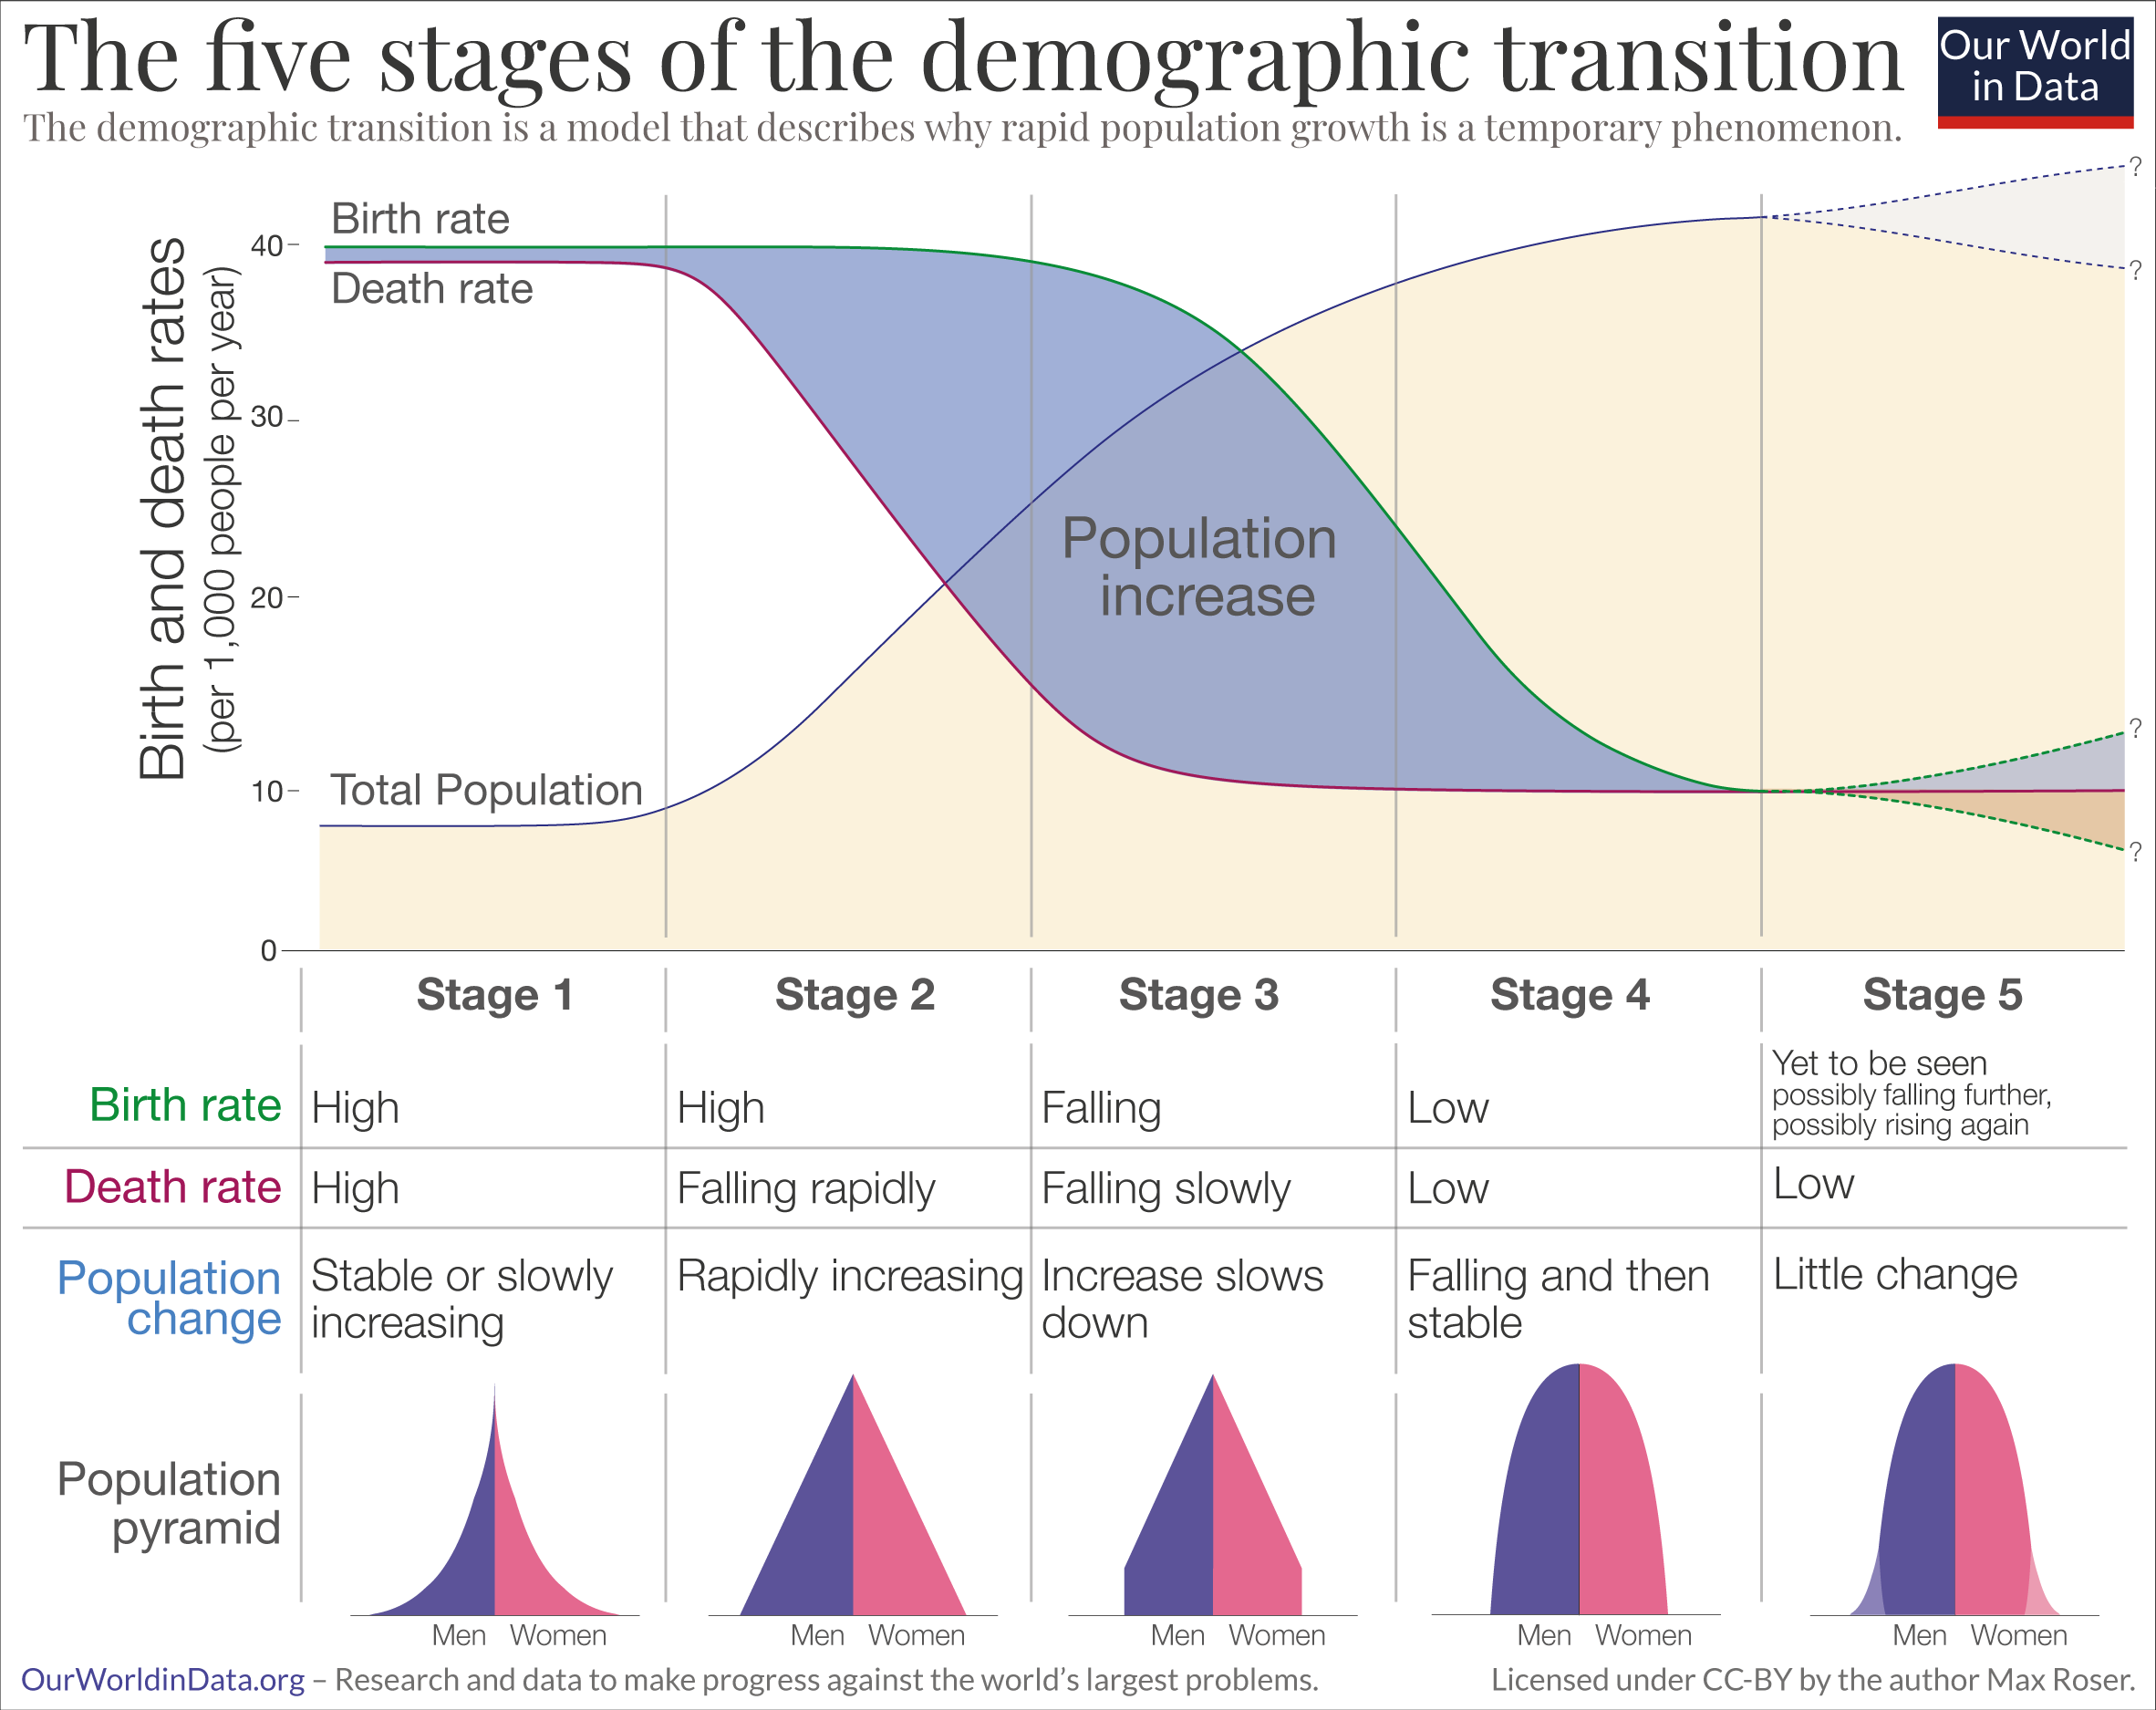
Population growth is determined by births and deaths. Every country has seen very substantial changes in both: mortality and fertility rates have fallen across the world.
However, declining mortality rates and declining fertility rates alone do not explain why populations grow. If these changes happened at the same time, the size of the population would not increase. What is crucial is the timing at which mortality and fertility change.
The model that explains why countries go through a period of rapid population growth is called the ‘demographic transition’. It is shown in the schematic figure. It is a beautifully simple model that describes the observed pattern in countries worldwide and is one of the great insights of demography.
Source 1: https://ourworldindata.org/population-growth-over-time
Source 2: https://ourworldindata.org/demographic-transition
CO2 Emissions per Capita | OurWorldInData.org
CO2 emissions are typically measured on the basis of ‘production’. This accounting method – which is sometimes referred to as ‘territorial’ emissions – is used when countries report their emissions, and set targets domestically and internationally.
In addition to the commonly reported territorial emissions statisticians also calculate ‘consumption-based’ emissions. These emissions are adjusted for trade. To calculate consumption-based emissions we need to track which goods are traded across the world, and whenever a good was imported we need to include all CO2 emissions that were emitted in the production of that good, and vice versa to subtract all CO2 emissions that were emitted in the production of goods that were exported.
Consumption-based emissions reflect the consumption and lifestyle choices of a country’s citizens.
The following chart compare CO2 emissions with GDP per capita. As the GDP is based on the country production, this data compare territorial production (GDP) with territorial emissions, meaning the emissions produced within a country’s borders, but not those from imported goods. For example, emissions from imported steel are counted in the country where the steel is produced.
Source 1 : https://ourworldindata.org/consumption-based-co2
Source 2 : https://ourworldindata.org/grapher/co2-emissions-vs-gdp





The Essential Guide to Men’s Dress Shirts
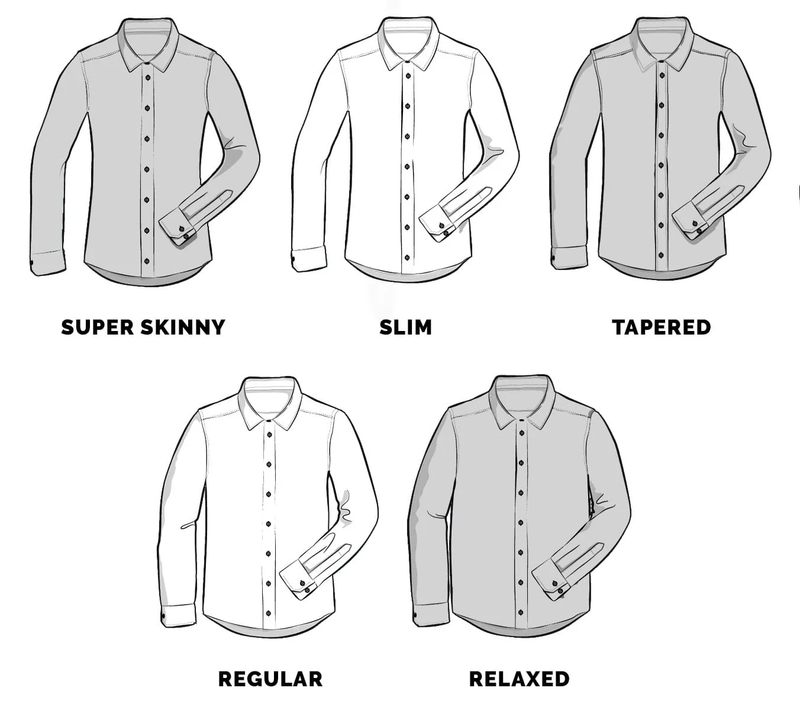
Fit
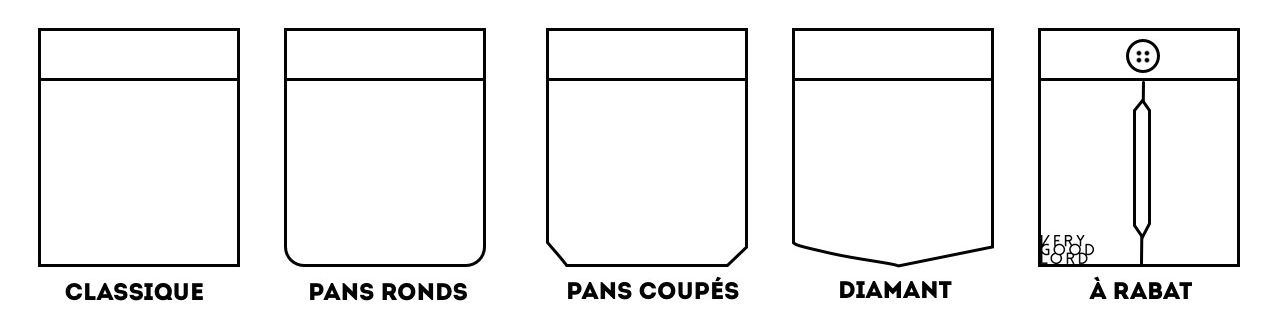
Men’s dress shirts come with or without a breast pocket.
• Formal shirt – No pocket.
• Casual shirts – Why not.
If you’re not going to use it, go without. Remember that shirts with breast pockets are unsuitable for the most formal events.
Evolution of Human Height in the World | OurWorldInData.org
Poor nutrition and illness in childhood limit human growth. As a consequence, the average height of a population is strongly correlated with living standards in a population. This makes the study of human height relevant for historians who want to understand the history of living conditions.
Because the effect of better material living standards is to make people taller, human height is used as an indirect measure of living standards. It is especially relevant for the study of living conditions in periods for which little or no other data is available — what historians refer to as the pre-statistical period.
It is important to stress that height is not used as a direct measure of well-being. The variation of height within a given population is largely determined by genetic factors.1
The history of human height allows us to track progress against undernourishment and disease and makes it possible to understand who started to benefit from modern advancements and when.
Source and more detailed information: https://ourworldindata.org/human-height

Dragon Ball | Mangas et Films

Mangas
| Titre | Volumes | Dates | Canon | Scénario | Période |
|---|---|---|---|---|---|
| Dragon Ball | 42 | 1984–1995 | ✅ | Toriyama | Enfance de Goku → Fin de l’arc Boo |
| Dragon Ball Super | 24 | 2015–en cours | ✅ | Toriyama | Post-arc Boo (avant l’épilogue de DBZ) |
| Jaco the Galactic Patrolman | 1 | 2013 | 🔶 | Toriyama | Préquel (lié à l’origine de Goku) |
| Dragon Ball Minus | 1 | 2014 | ✅ | Toriyama | Origine de Goku (intégré à Broly) |
| Dragon Ball SD (Super Deformed) | 10 | 2010–en cours | ❌ | Ooishi | Parodie des arcs classiques |
Légende :
✅ Canon : Fait partie de l’histoire principale approuvée par Toriyama.
🔶 Semi-canon : Éléments partiellement intégrés (ex : Jaco explique des détails de Super).
❌ Non-canon : Œuvres dérivées sans impact sur la timeline officielle.


