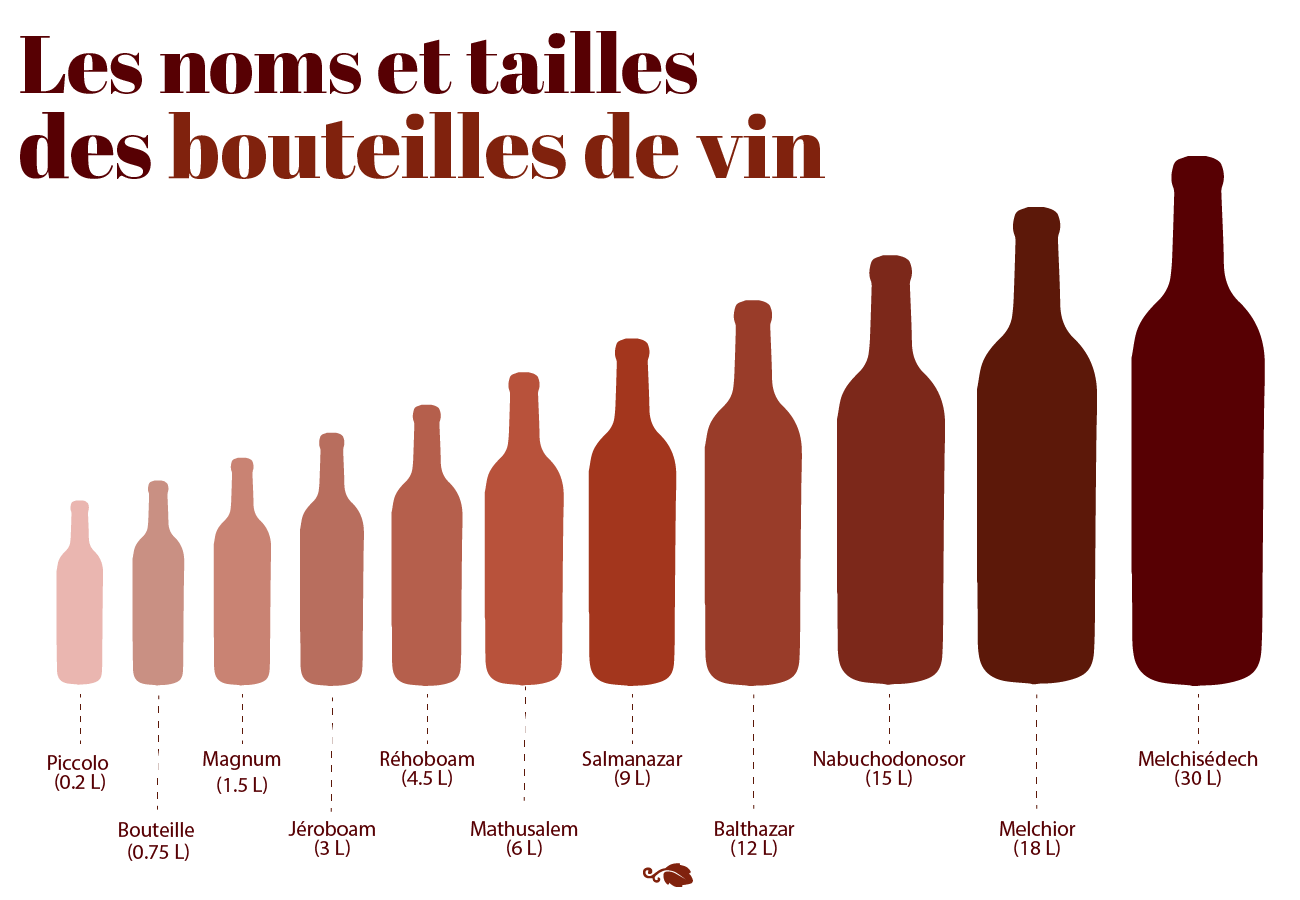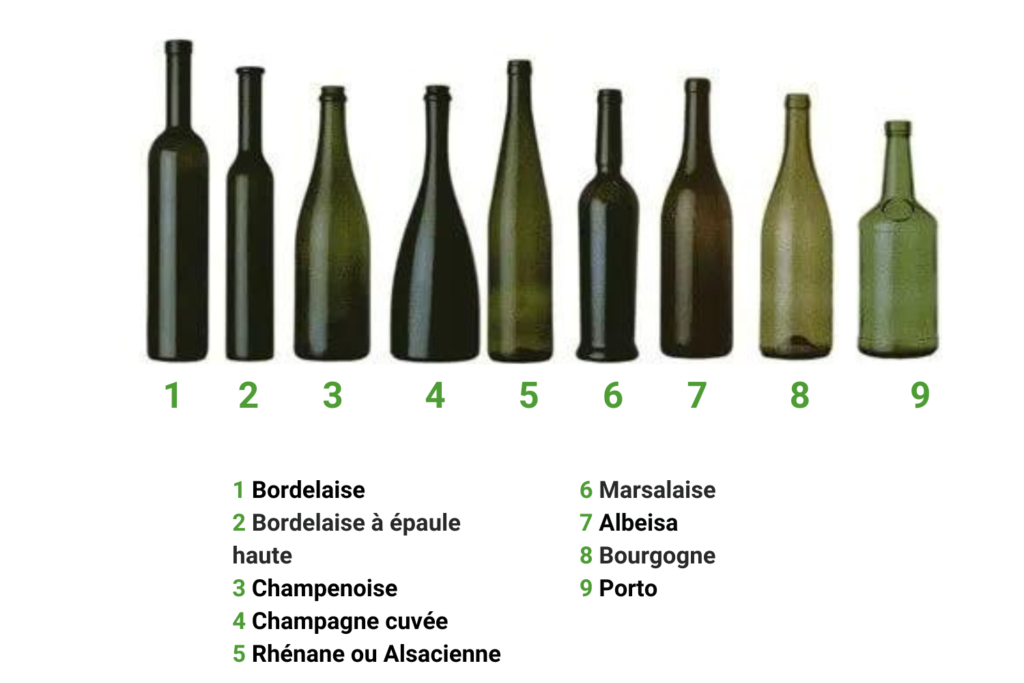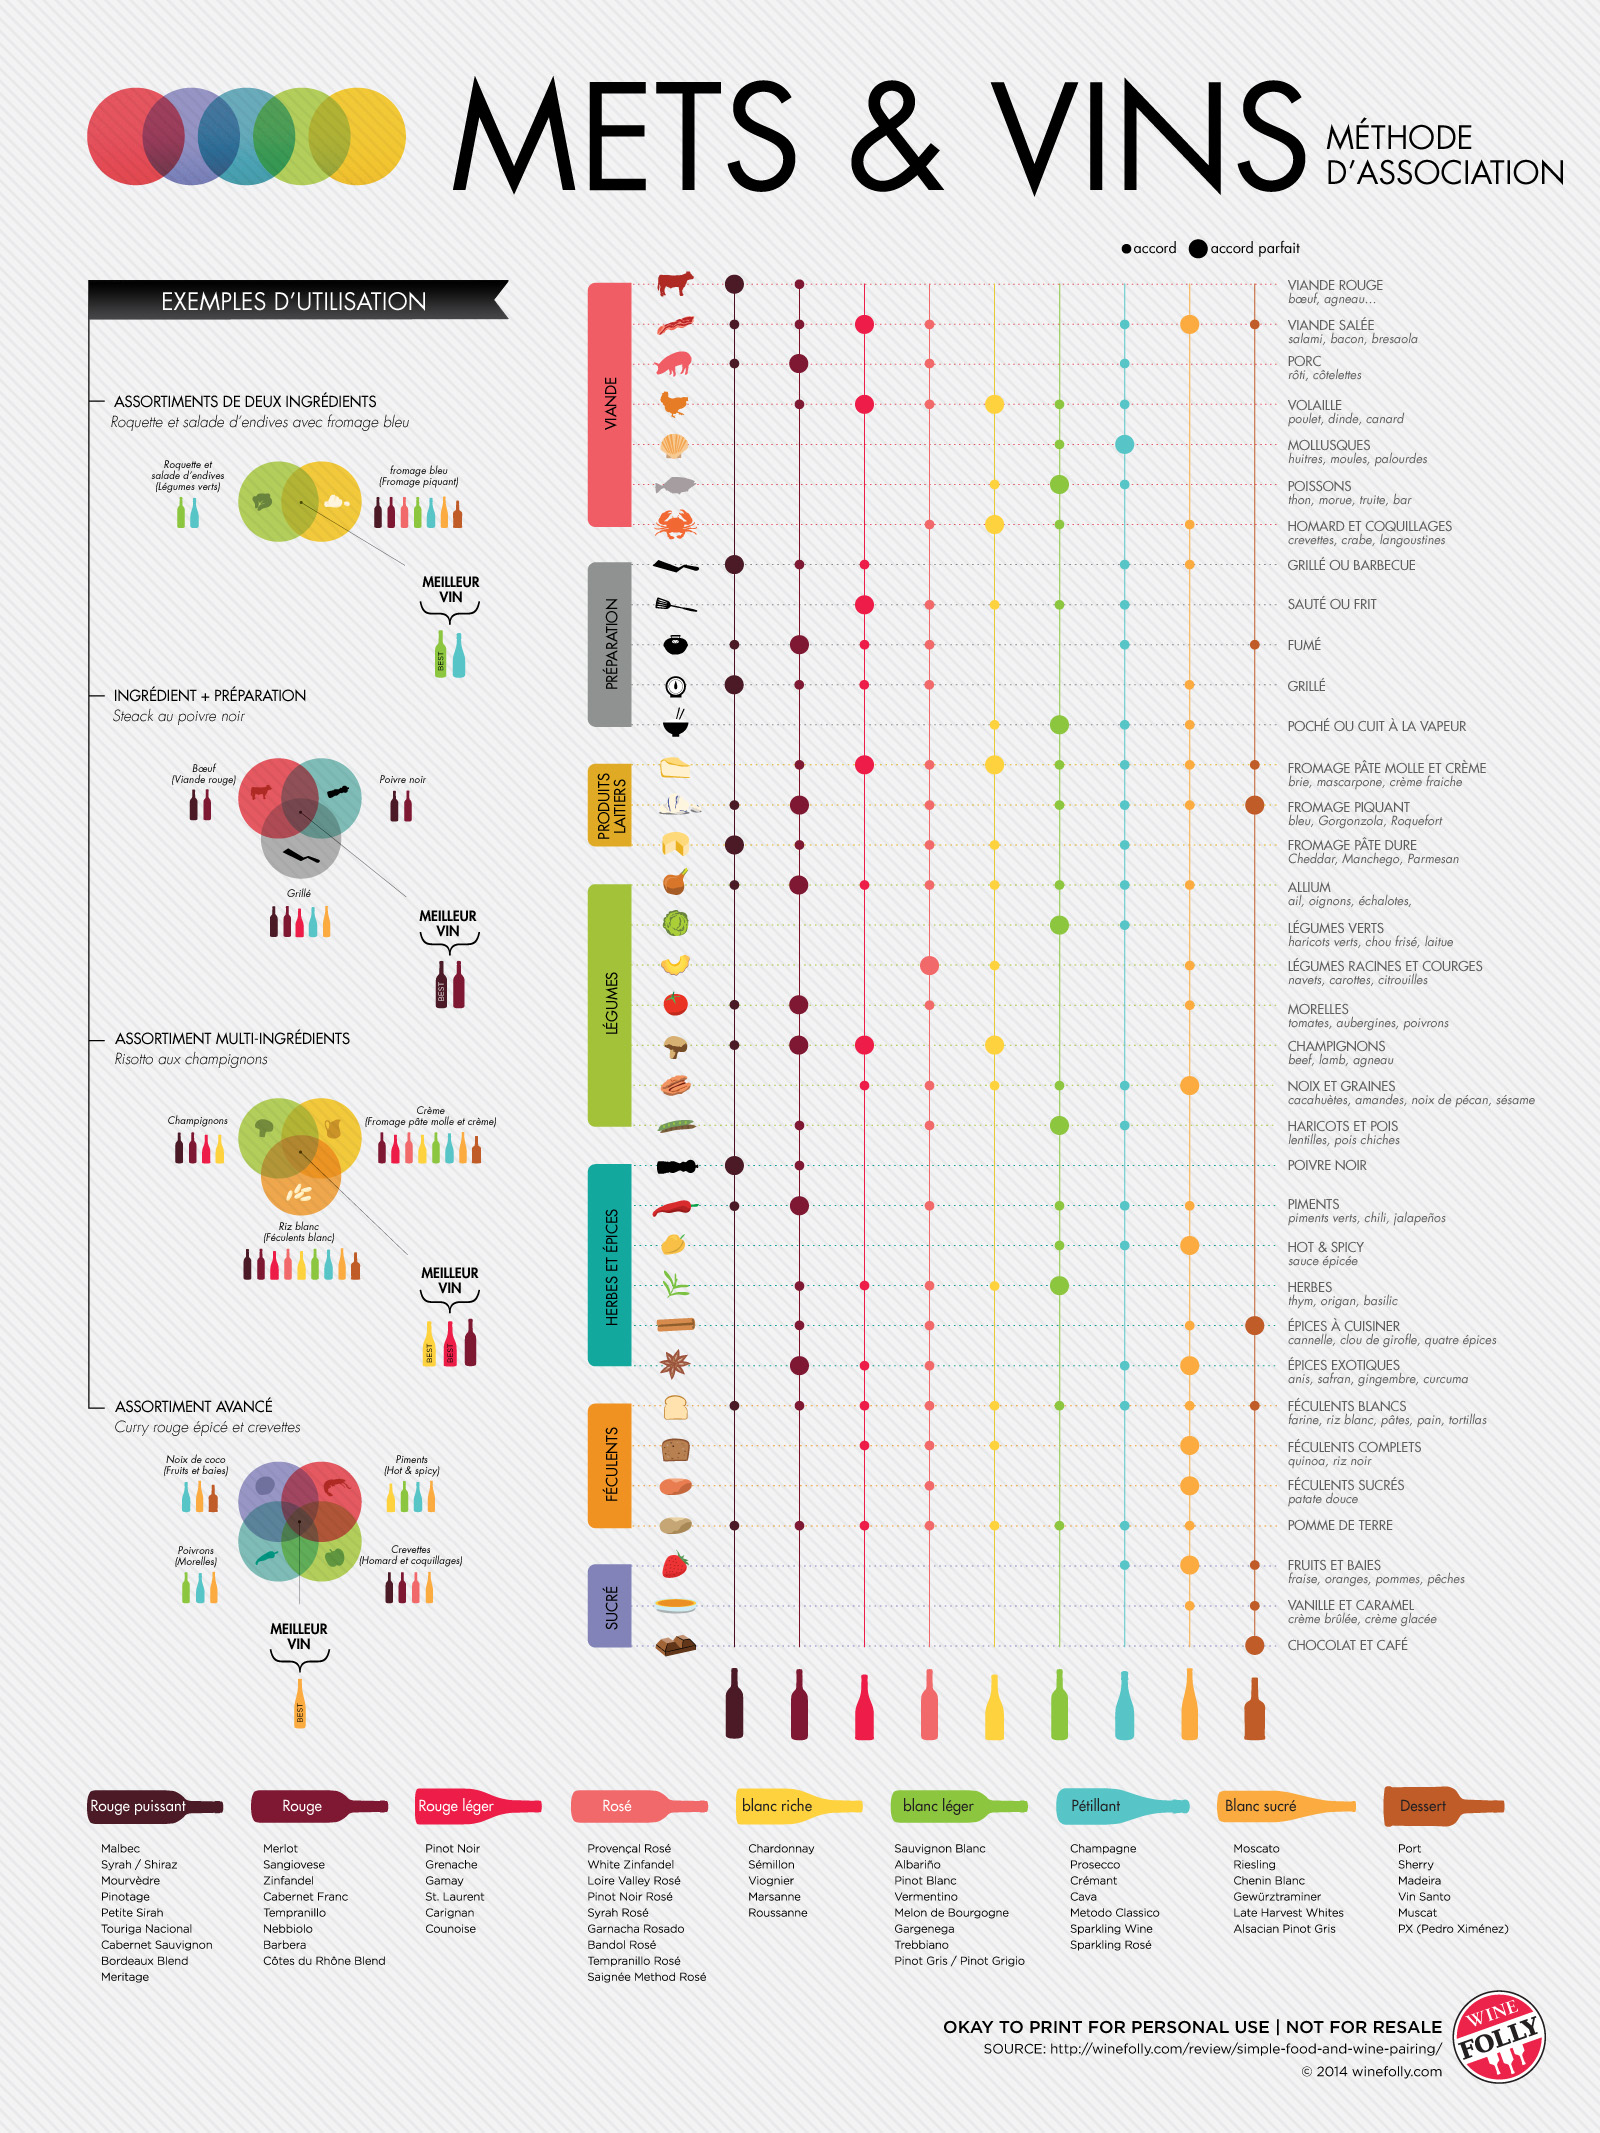
Accords Mets-Vins
Voici les règles suisses de rachat dans la caisse de pension (LPP) après un retrait pour l’achat d’un logement (encouragement à la propriété du logement – EPL).
Lorsque vous avez retiré des avoirs LPP pour acheter, construire ou amortir un logement occupé à titre personnel, vous ne pouvez pas effectuer de rachats volontaires dans votre caisse de pension tant que ce retrait n’a pas été remboursé.
👉 Priorité absolue : le remboursement du retrait EPL.
Le remboursement n’est pas déductible fiscalement
Une fois le retrait EPL entièrement remboursé :
✅ Les rachats volontaires sont à nouveau autorisés
✅ Les rachats sont déductibles fiscalement
❗ Sous réserve des règles générales de rachat :
Les cotisations versées chaque mois dans le cadre de ton emploi :
➡️ reconstituent ton avoir vieillesse,
➡️ mais ne réduisent pas le montant du retrait EPL à rembourser.
Aux yeux de la loi :
Seuls sont considérés comme remboursement EPL :
✅ des versements volontaires explicites
✅ effectués directement à la caisse de pension
✅ déclarés comme remboursement du retrait EPL
➡️ Ils doivent être comptabilisés séparément par la caisse de pension.
La Bible, texte fondateur du judaïsme et du christianisme, contient des centaines de lois, de préceptes et de récits qui reflètent les normes sociales, religieuses et juridiques de l’Antiquité. Certaines de ces règles, si elles étaient appliquées littéralement aujourd’hui, seraient non seulement contraires aux valeurs démocratiques modernes (égalité, droits humains, liberté individuelle), mais aussi illégales selon les lois internationales et nationales.
1. Esclavage
Exode 21:2-6, 20-21 : “Si tu achètes un esclave hébreu, il servira six années ; mais la septième, il sortira libre, sans rien payer. […] Si un homme frappe son esclave, homme ou femme, avec un bâton, et que l’esclave meure sous sa main, il sera puni. Mais s’il survit un jour ou deux, il ne sera pas puni, car c’est son argent.”
Un maître pouvait battre son esclave à mort sans être puni si l’esclave ne mourait pas immédiatement. Les esclaves étaient considérés comme des propriétés, sans droits fondamentaux.
Skyscanner : Comparaison exhaustive des vols, avec options de recherche flexibles (dates, aéroports).
Google Flights : Interface intuitive, filtres puissants et alertes prix.
Kayak : Agrège les offres de nombreuses compagnies et agences, inclut les vols low-cost.
Momondo : Moteur de recherche global, souvent des prix très compétitifs.
Booking.com : Large choix, filtres détaillés et avis vérifiés.
Trivago : Compare les prix de centaines de sites (Booking, Expedia, etc.).
Agoda : Spécialisé en Asie, mais aussi très utile en Europe et dans le monde.
CozyCozy : Moteur de recherche et comparateur d’hébergements (hôtels, appartements, maisons de vacances, glampings) qui agrège les offres de plusieurs plateformes (Airbnb, Booking, Vrbo, etc.).
Hostelworld : La référence pour les auberges de jeunesse, avec des avis détaillés et des filtres pratiques (prix, note, équipements).
HI Hostels (Hostelling International) : Réseau historique d’auberges de jeunesse, avec des standards de qualité.
Couchsurfing Pour un hébergement gratuit chez l’habitant, avec une communauté de voyageurs.
Workaway / HelpX Échange travail contre hébergement (ex : aider dans une auberge en Grèce ou une ferme en Espagne). Points forts : Voyage longue durée à moindre coût.
Airbnb : Plateforme polyvalente proposant des hébergements variés (appartements, maisons, chambres privées).
Expedia : Vols + hôtels + activités, souvent des packs avantageux.
Opodo : Propose des forfaits vols + hôtels à prix réduits.
Lastminute.com : Spécialisé dans les offres de dernière minute.
Promovacances : Comparateur français pour les séjours organisés.
Weekendesk : Offres packagées (hébergement + activités, repas, spa, etc.) à prix réduits, souvent avec des partenariats exclusifs.
Skiinfo : Compare les forfaits ski, hébergements et locations de matériel.
Snowtrex : Spécialisé dans les séjours au ski en Europe.
Travelski : Offres pour les stations françaises et européennes.
Sunweb : Forfaits tout compris (hébergement, forfait de ski, location de matériel, cours, etc.) dans plus de 300 stations en Europe (France, Autriche, Italie, Suisse, etc.).
UCPA : Référence pour les stages sportifs en Europe (ski, escalade, voile, trail, etc.).
Rentalcars.com : Compare les loueurs (Hertz, Avis, Europcar, etc.).
Kayak Voitures : Intègre la comparaison de locations dans ses résultats de voyage.
Discovercars.com : Comparateur international avec de bonnes offres.
Trainline : Compare les prix des trains en Europe (SNCF, Deutsche Bahn, etc.).
Omio : Vols, trains et bus en un seul endroit.
Voyages-sncf.com : Pour les trajets en France et en Europe.
Rail Europe : Pour les billets de train internationaux.
GetYourGuide : Comparaison d’excursions, visites guidées et activités.
Klook : Billets pour attractions, parcs et expériences.
Musement : Réservations d’activités et visites.
| Pays | Site local | Lien |
|---|---|---|
| Allemagne | Idealo | https://www.idealo.de/ |
| Autriche | Geizhals | https://geizhals.at/ |
| Belgique | Kelkoo | https://fr.kelkoo.be/ |
| Espagne | Idealo | https://www.idealo.es/ |
| France | Idealo | https://www.idealo.fr/ |
| Italie | TrovaPrezzi | https://www.trovaprezzi.it/ |
| Portugal | KuantoKusta | https://www.kuantokusta.pt/ |
| Royaume-Uni | PriceRunner | https://www.pricerunner.com |
| Suisse | TopPreise | https://www.toppreise.ch |
Autres sites intéressants :
Google Shopping : Disponible dans de nombreux pays, idéal pour comparer rapidement.
CamelCamelCamel : Spécialisé pour suivre l’historique des prix sur Amazon (États-Unis, Royaume-Uni, Allemagne, etc.).
Lyst : Agrège les boutiques en ligne (Zalando, Farfetch, etc.) pour la mode.
ShopStyle : Comparaison de vêtements, chaussures et accessoires.
Idealo Mode : Section dédiée à la mode sur Idealo.
Idealo : Référence en Europe pour comparer les prix.
Priceminister (Rakuten) : Large choix de produits high-tech.
CamelCamelCamel : Suivi des prix sur Amazon.
Price-Volume-Mix (PVM) analysis is a fundamental tool in financial management and business intelligence. It allows companies to understand exactly why their revenue changed between two periods by decomposing the total variance into distinct, actionable components.
This analytical method is crucial for:
When revenue changes from one period to another, three main factors can be responsible:
Understanding which of these factors drove the change is essential for management to make informed decisions.
Continue reading “Price-Volume-Mix Analysis | A Comprehensive Guide”The world population has changed dramatically over the last few centuries. Let’s examine long-run population data to understand this change and how quickly the world’s population is growing today.
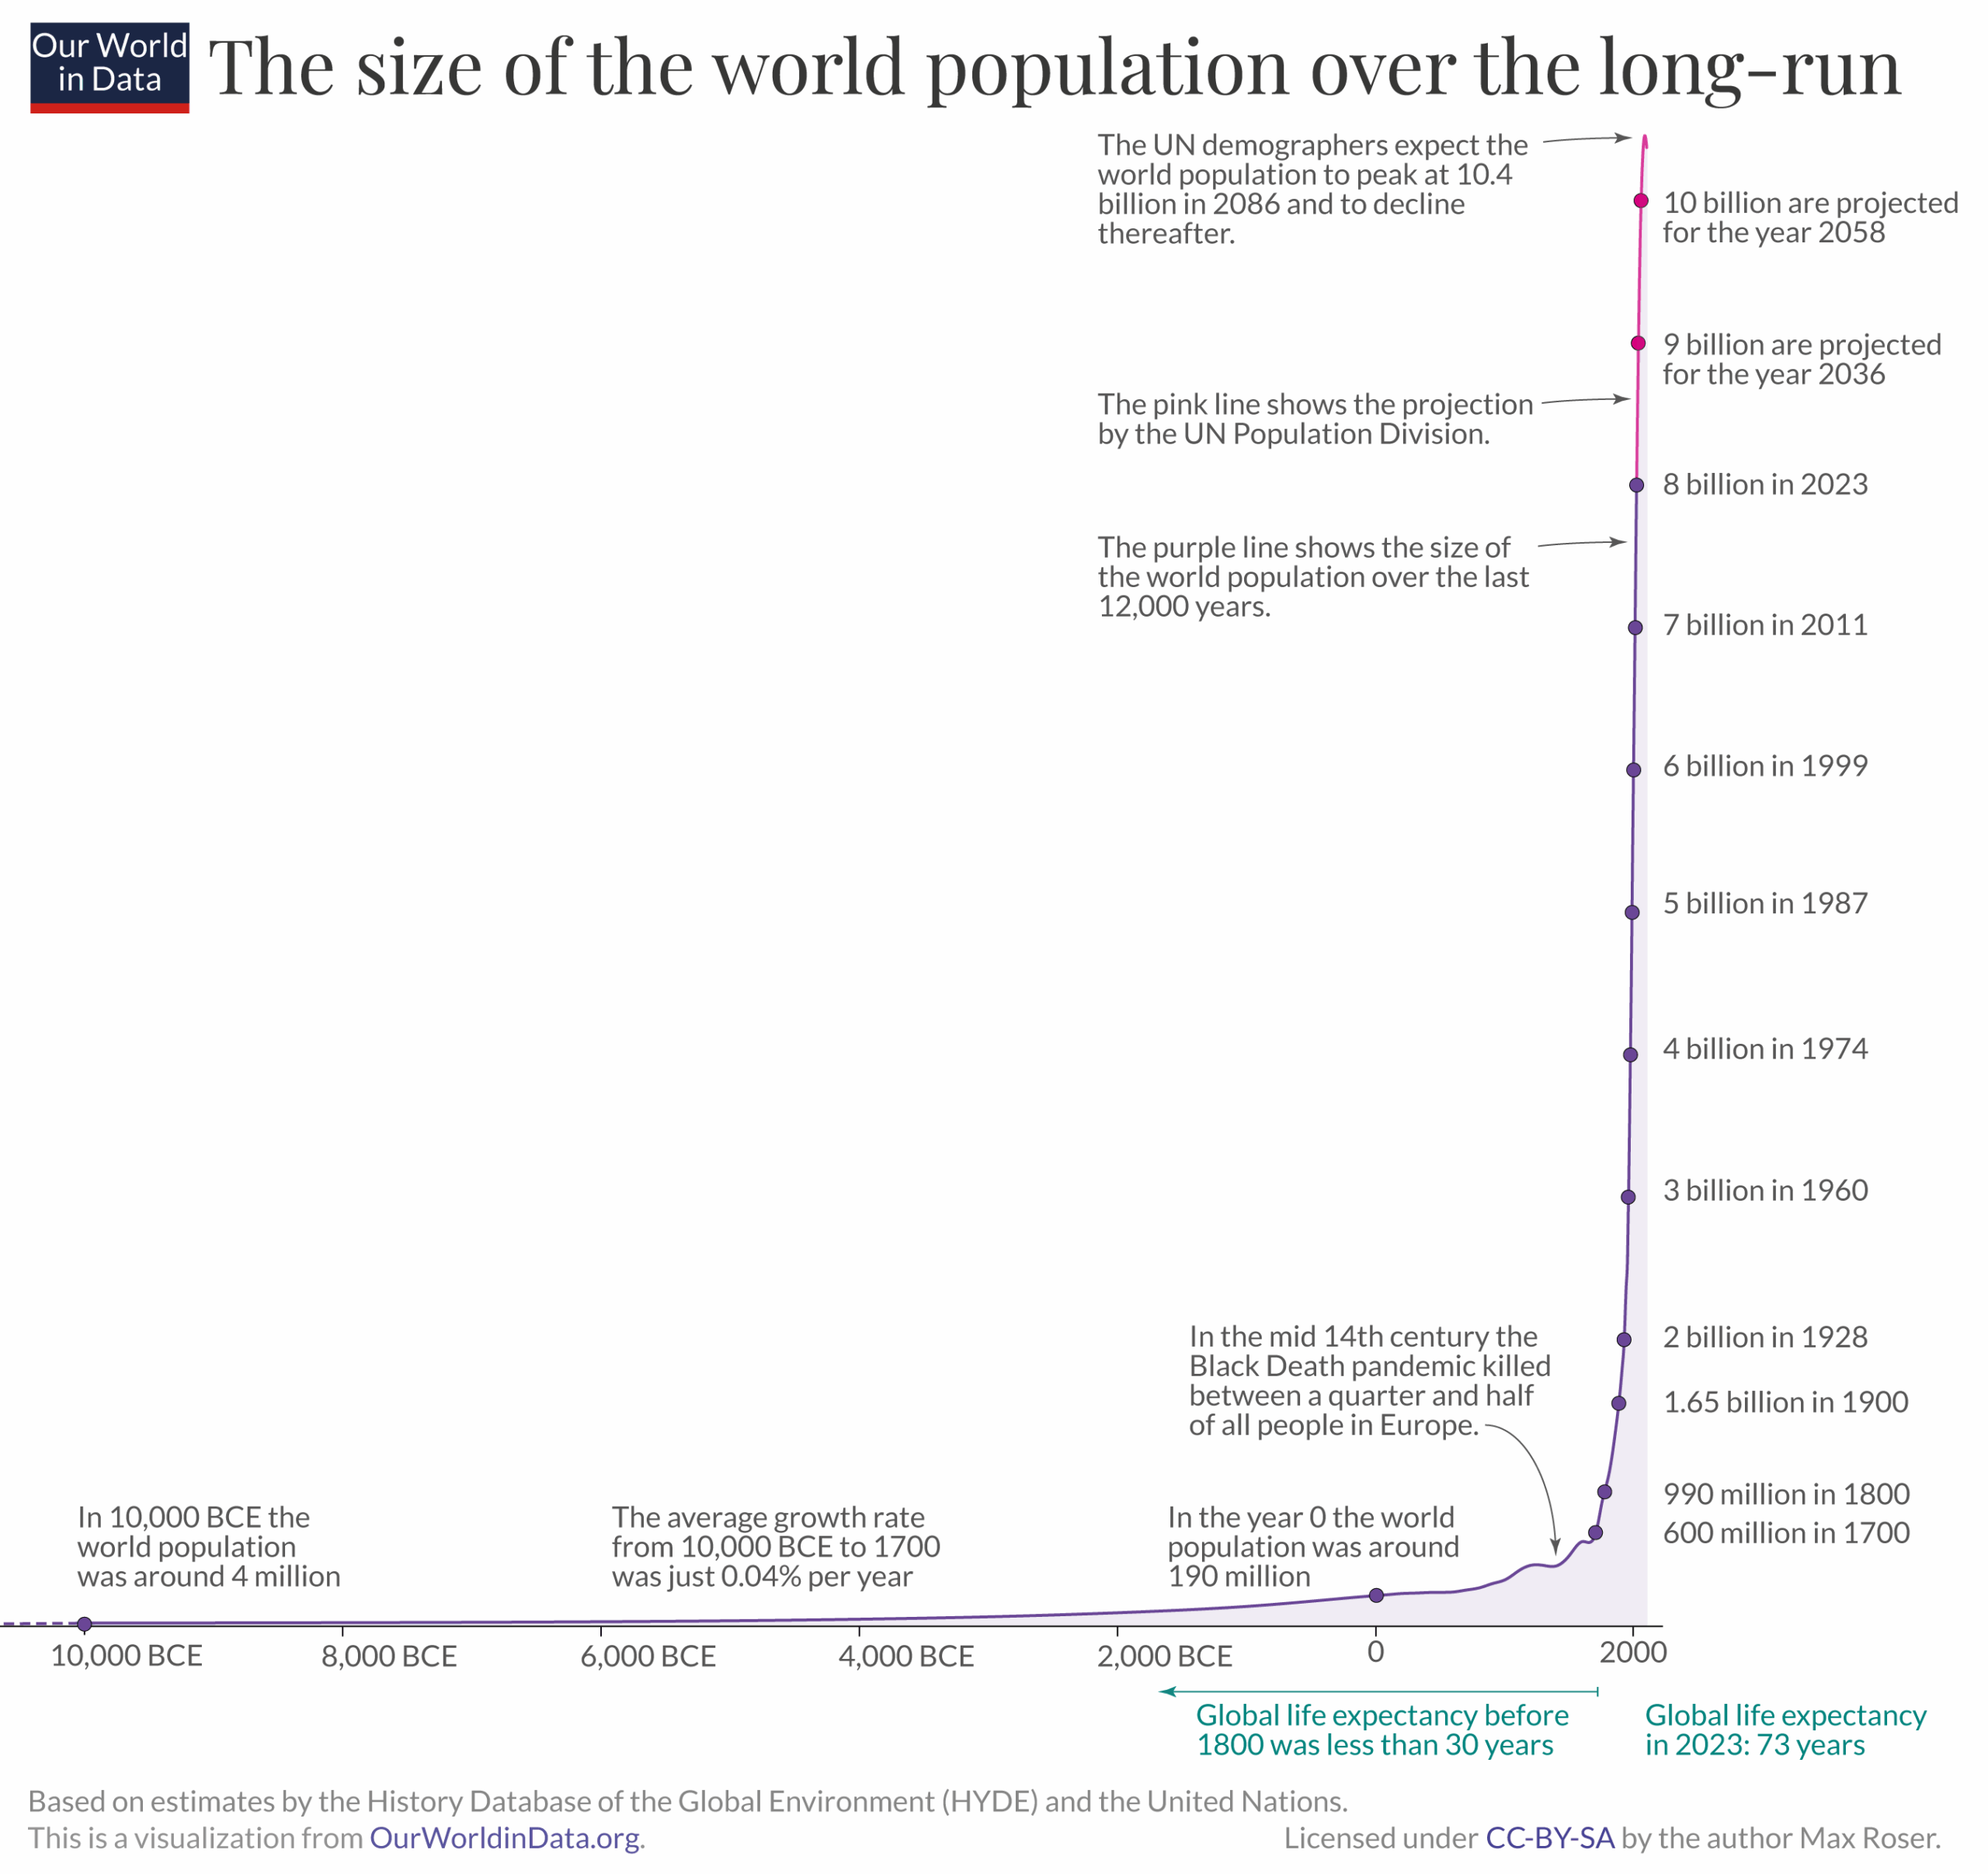
The global population growth rate peaked long ago. The chart shows that global population growth peaked in 1962 and 1963 with an annual growth rate of 2.2%; however, since then, world population growth has halved.
For the last half-century, the population growth rate has been declining. The UN projects that this decline will continue in the coming decades.
A common question we’re asked is: is the global population growing exponentially? The answer is no.
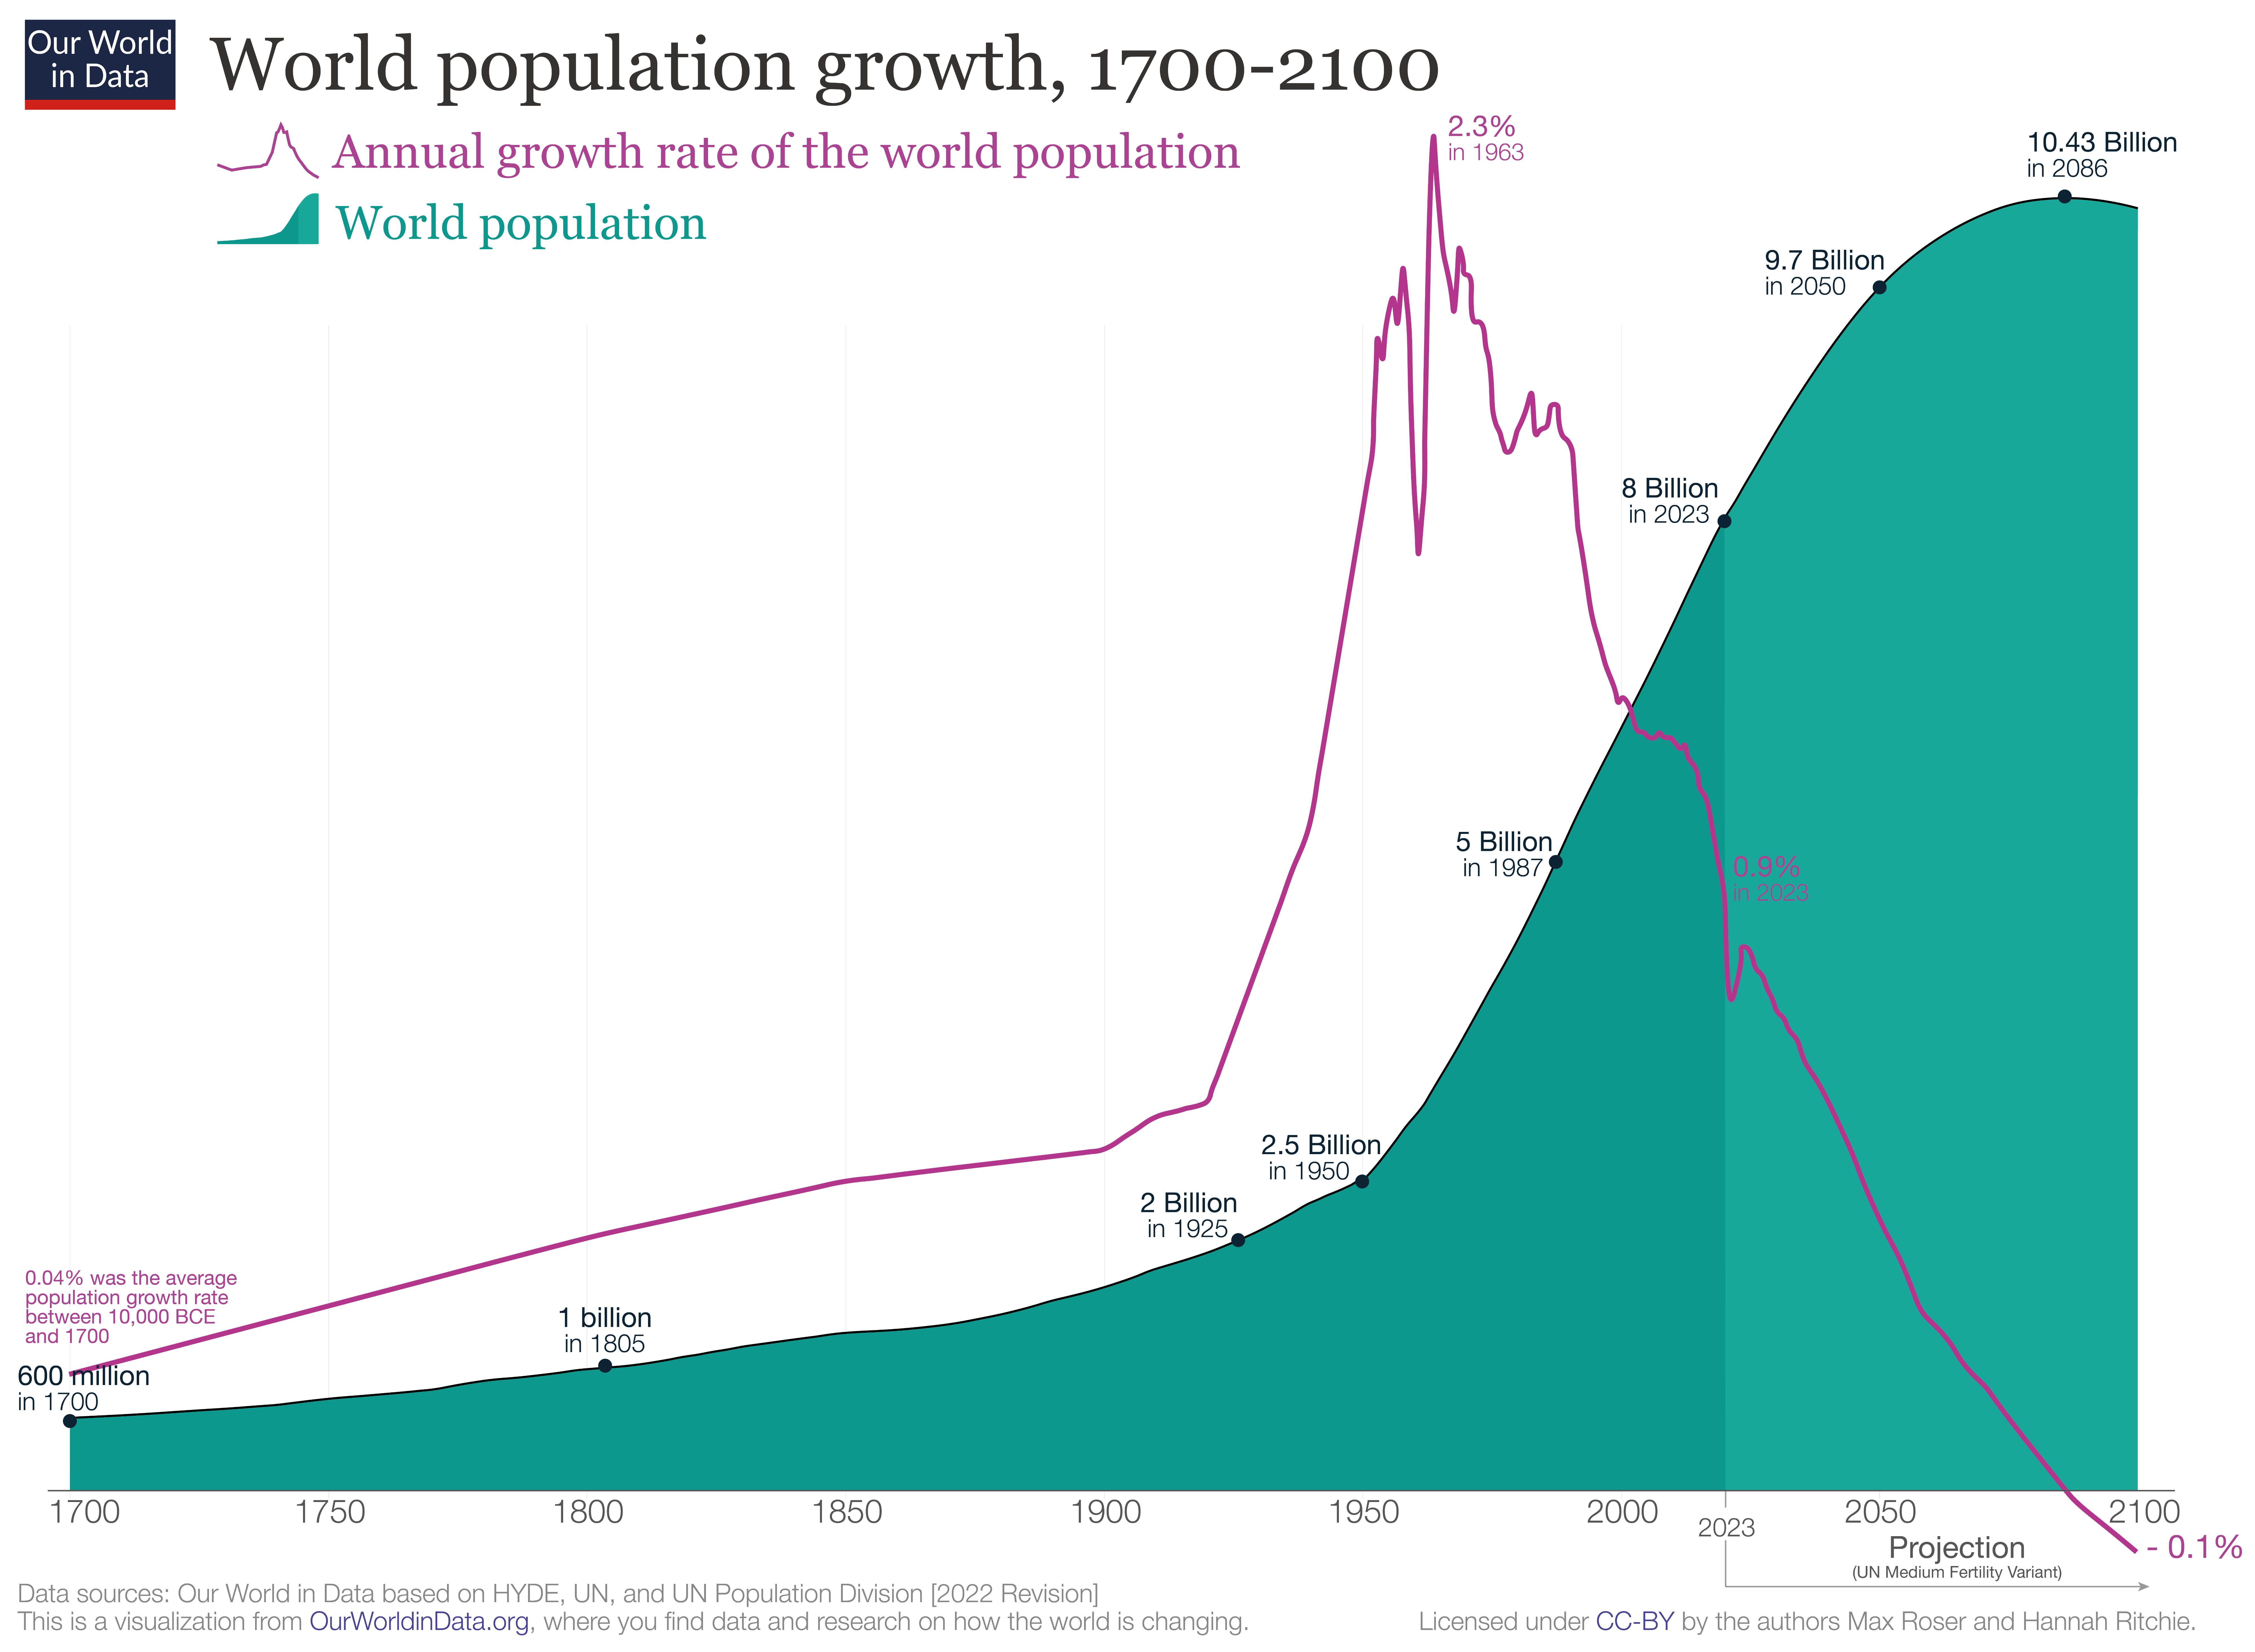
Population growth is determined by births and deaths. Every country has seen very substantial changes in both: mortality and fertility rates have fallen across the world.
However, declining mortality rates and declining fertility rates alone do not explain why populations grow. If these changes happened at the same time, the size of the population would not increase. What is crucial is the timing at which mortality and fertility change.
The model that explains why countries go through a period of rapid population growth is called the ‘demographic transition’. It is shown in the schematic figure. It is a beautifully simple model that describes the observed pattern in countries worldwide and is one of the great insights of demography.
Source 1: https://ourworldindata.org/population-growth-over-time
Source 2: https://ourworldindata.org/demographic-transition
CO2 emissions are typically measured on the basis of ‘production’. This accounting method – which is sometimes referred to as ‘territorial’ emissions – is used when countries report their emissions, and set targets domestically and internationally.
In addition to the commonly reported territorial emissions statisticians also calculate ‘consumption-based’ emissions. These emissions are adjusted for trade. To calculate consumption-based emissions we need to track which goods are traded across the world, and whenever a good was imported we need to include all CO2 emissions that were emitted in the production of that good, and vice versa to subtract all CO2 emissions that were emitted in the production of goods that were exported.
Consumption-based emissions reflect the consumption and lifestyle choices of a country’s citizens.
The following chart compare CO2 emissions with GDP per capita. As the GDP is based on the country production, this data compare territorial production (GDP) with territorial emissions, meaning the emissions produced within a country’s borders, but not those from imported goods. For example, emissions from imported steel are counted in the country where the steel is produced.
Source 1 : https://ourworldindata.org/consumption-based-co2
Source 2 : https://ourworldindata.org/grapher/co2-emissions-vs-gdp
The classification of United States regions has sparked ongoing debate for decades. The challenge stems from a fundamental mismatch: geographic and cultural boundaries rarely align neatly with state lines. For truly accurate regional divisions, states would need to be subdivided—a Texas panhandle resident, after all, may have more in common with Oklahoma than with coastal Houston.
In practice, achieving consensus on regional definitions proves nearly impossible. Different organizations—from the Census Bureau to cultural geographers—draw the lines differently depending on their purposes. What follows is probably the most widely recognized approach to dividing America into regions.

Simulation d’ensoleillement sur 365 jours par an, permet de voir les opportunités d’économie d’énergie, planifier des améliorations et trouver les zones ensoleillées.
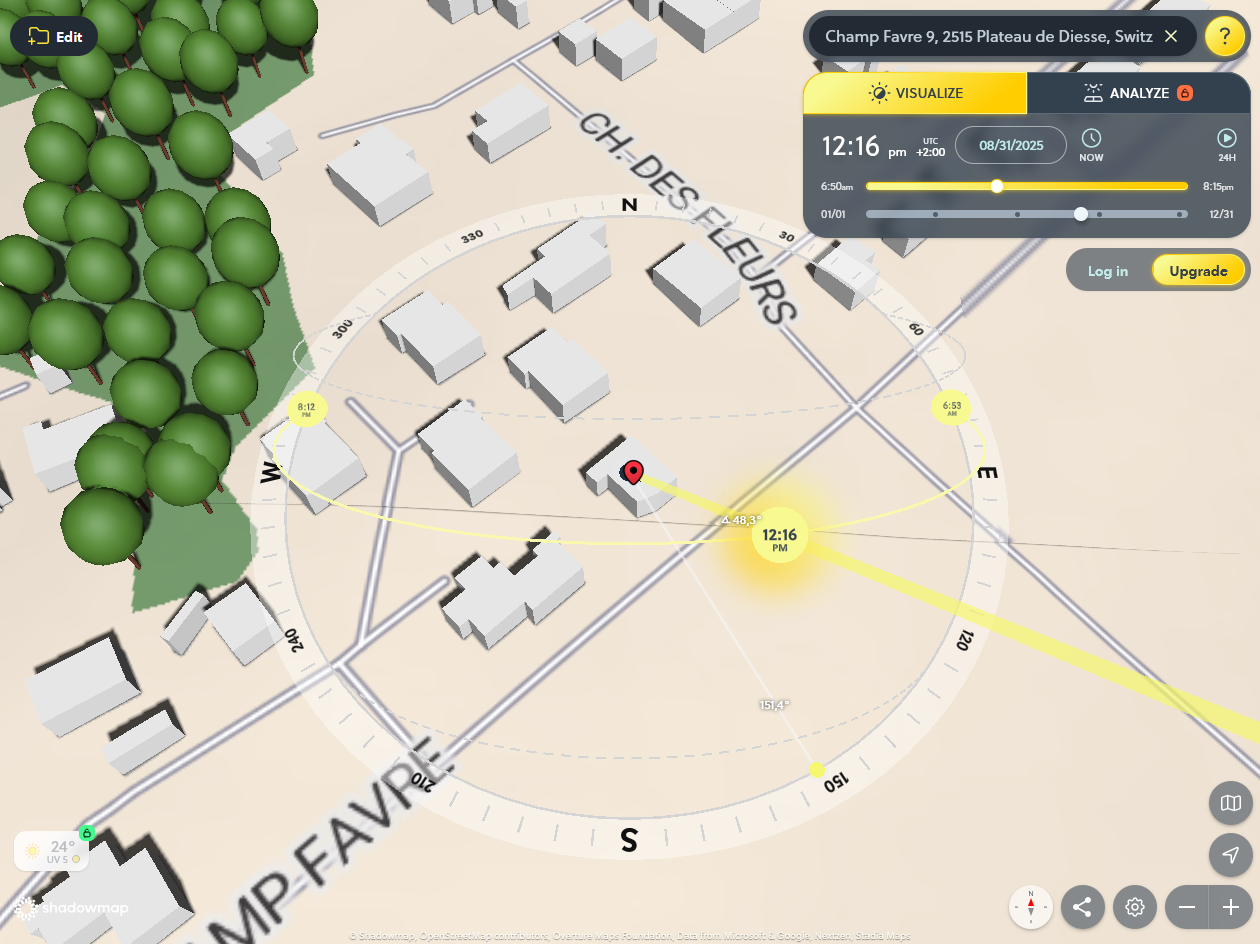
Permet de découvrir combien d’électricité et de chaleur votre toit peut produire, sur la base de l’ensoleillement annuel, détaillé par mois. Fonctionne aussi pour les façades. Site officiel suisse, ne couvrant que le territoire national.


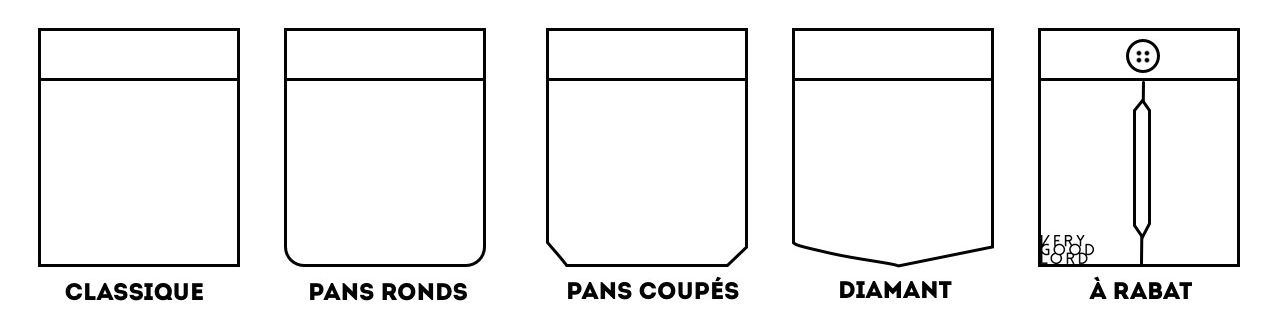
Men’s dress shirts come with or without a breast pocket.
• Formal shirt – No pocket.
• Casual shirts – Why not.
If you’re not going to use it, go without. Remember that shirts with breast pockets are unsuitable for the most formal events.
Poor nutrition and illness in childhood limit human growth. As a consequence, the average height of a population is strongly correlated with living standards in a population. This makes the study of human height relevant for historians who want to understand the history of living conditions.
Because the effect of better material living standards is to make people taller, human height is used as an indirect measure of living standards. It is especially relevant for the study of living conditions in periods for which little or no other data is available — what historians refer to as the pre-statistical period.
It is important to stress that height is not used as a direct measure of well-being. The variation of height within a given population is largely determined by genetic factors.1
The history of human height allows us to track progress against undernourishment and disease and makes it possible to understand who started to benefit from modern advancements and when.
Source and more detailed information: https://ourworldindata.org/human-height
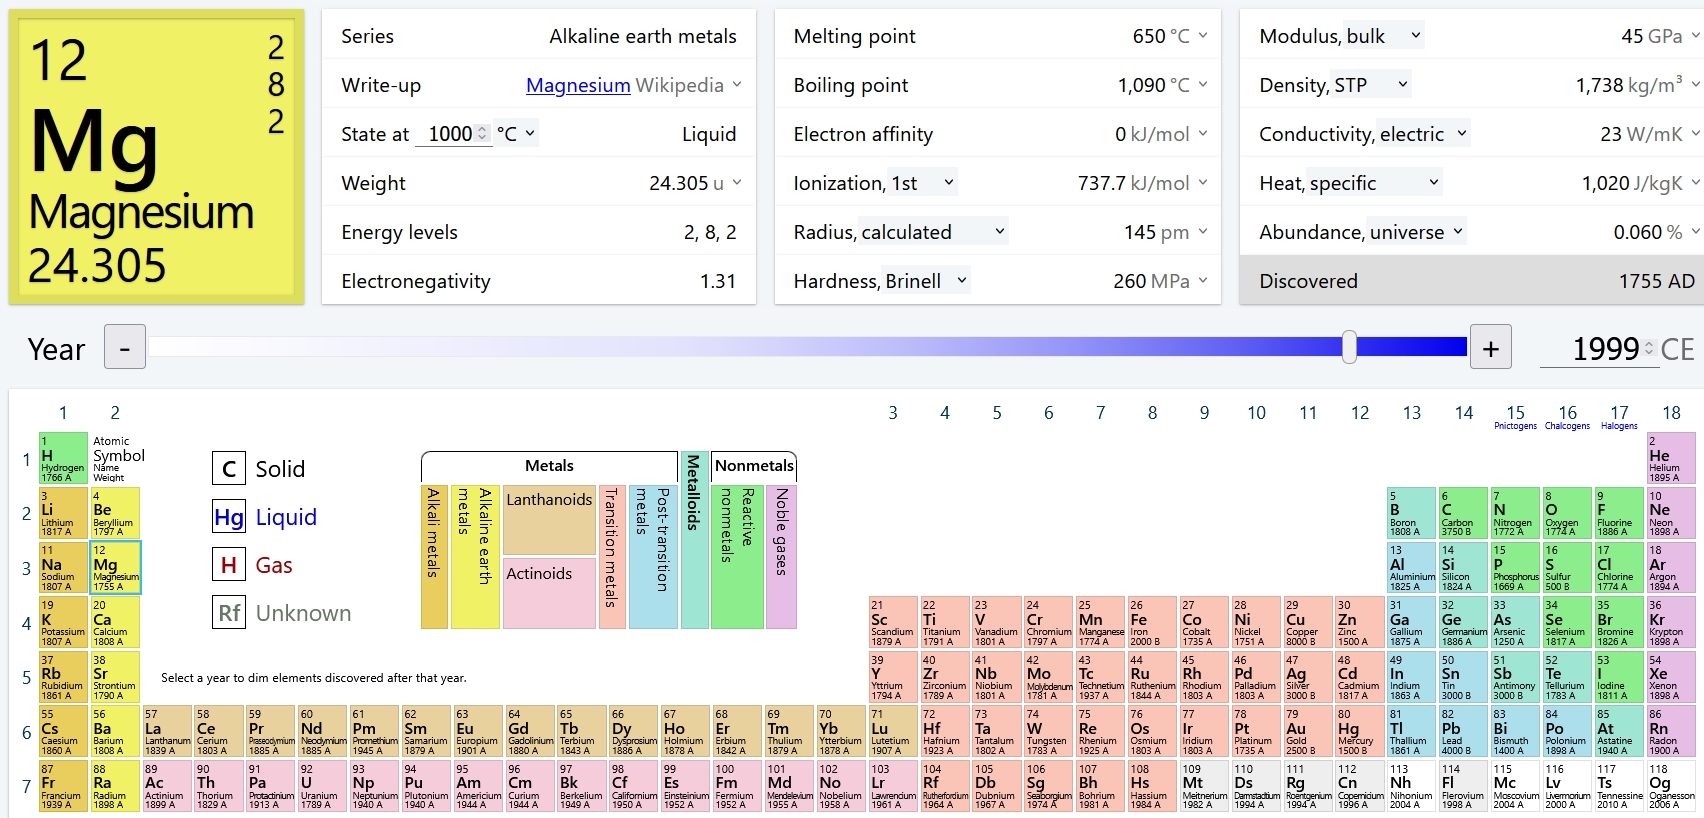
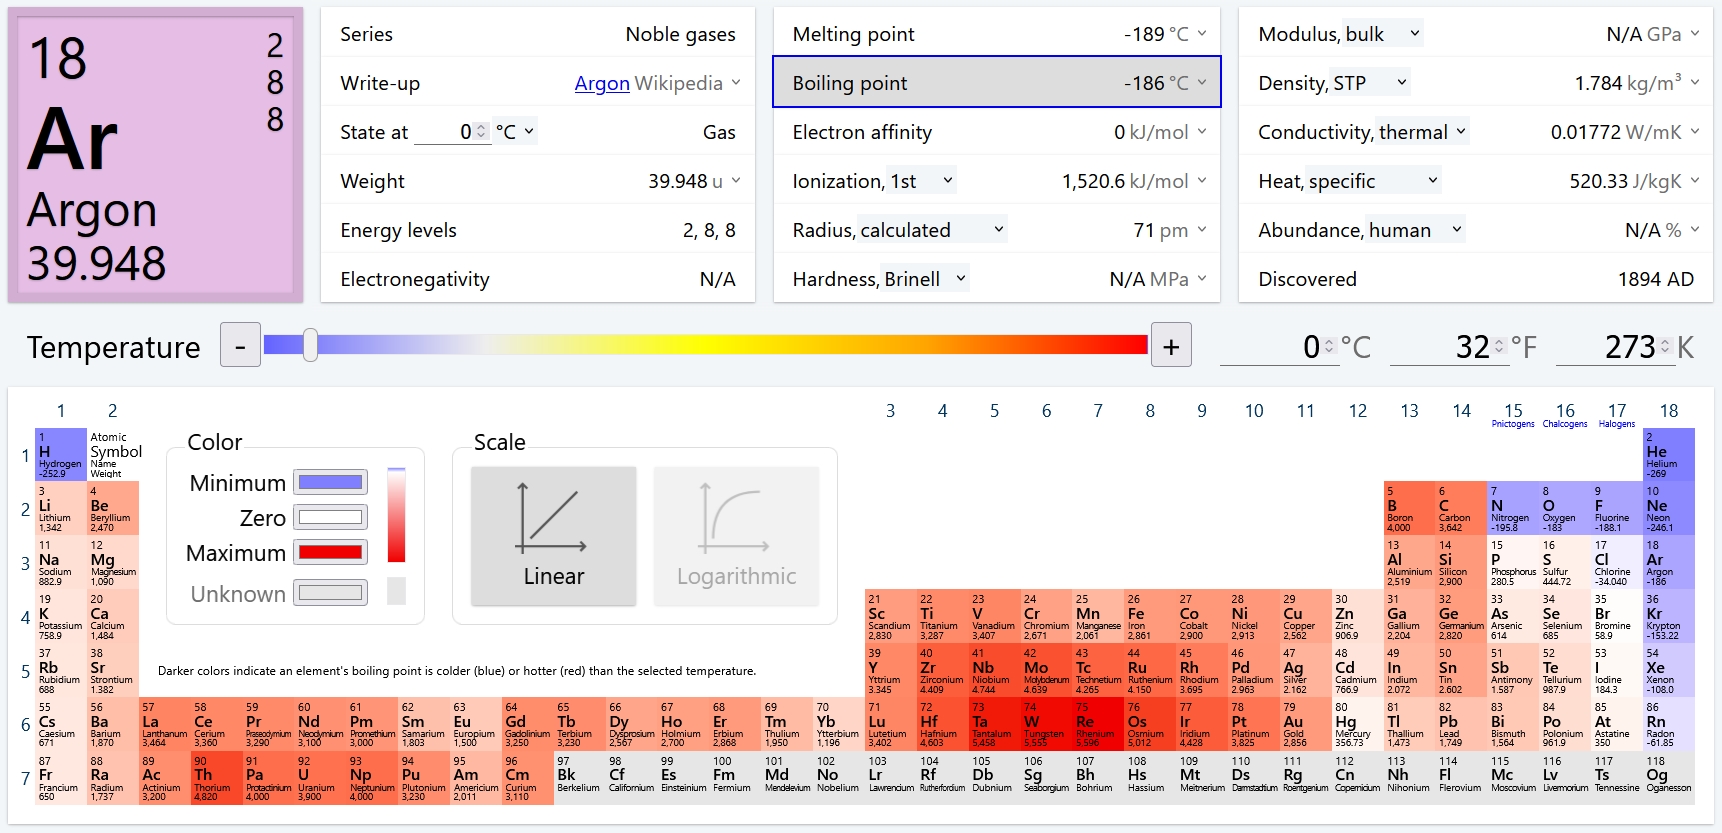
Ptable.com is a dynamic, web-based periodic table of elements that offers a powerful and intuitive interface for students, educators, and professionals alike. Unlike traditional printed tables, Ptable updates in real-time and integrates data-rich content like element properties, isotopes, and historical data, all presented in a highly interactive and user-friendly format.
Notable features:
• Instant data access – Hover over or click any element to see detailed information including properties, electron configurations, and oxidation states.
• Multiple views – Switch between physical, atomic, orbital, and isotopic views to suit your learning or research needs.
• Multilingual support – Available in dozens of languages, making it accessible to a global audience.
• Real-time updates – Constantly maintained with up-to-date scientific information.
• Mobile-friendly – Works smoothly across devices without needing to install anything.
Isochrone maps visualize areas reachable within the same travel time from a starting point (e.g., “30 minutes by car from Geneva”).
Advanced tools allow you to:
• Combine multiple isochrones (e.g., overlap a 60-minute zone from Geneva and a 30-minute zone from Yverdon).
• Filter results to show only areas meeting all criteria.


Les vers de terre constituent la moitié de la biomasse animale terrestre.
1. Le poids écrasant des vers de terre
Un monopole inattendu
Selon une étude publiée dans PNAS (2018, voir source en bas de ce post), les vers de terre représentent environ 1,2 milliard de tonnes métriques, soit 50% de la biomasse animale terrestre totale.
En comparaison (voir tableau plus bas) :
• Le bétail domestique (vaches, porcs, moutons) pèse 600 millions de tonnes (25%).
• Les humains atteignent 60 millions de tonnes (2,5%).
• Tous les mammifères sauvages (éléphants, loups, cerfs) ne totalisent que 20 millions de tonnes (0,8%).
Cette domination s’explique par leur densité phénoménale : dans une prairie fertile, on peut trouver jusqu’à 1 million de vers par hectare, pesant collectivement 1 à 3 tonnes.
Pourquoi une telle abondance ?
• Une adaptation parfaite : Présents sur tous les continents (sauf déserts et glaciers).
• Un cycle de vie rapide : Certaines espèces produisent 100 œufs par an.
• Peu de prédateurs directs : Les taupes et oiseaux en mangent, mais pas assez pour limiter leur expansion.

| Titre | Volumes | Dates | Canon | Scénario | Période |
|---|---|---|---|---|---|
| Dragon Ball | 42 | 1984–1995 | ✅ | Toriyama | Enfance de Goku → Fin de l’arc Boo |
| Dragon Ball Super | 24 | 2015–en cours | ✅ | Toriyama | Post-arc Boo (avant l’épilogue de DBZ) |
| Jaco the Galactic Patrolman | 1 | 2013 | 🔶 | Toriyama | Préquel (lié à l’origine de Goku) |
| Dragon Ball Minus | 1 | 2014 | ✅ | Toriyama | Origine de Goku (intégré à Broly) |
| Dragon Ball SD (Super Deformed) | 10 | 2010–en cours | ❌ | Ooishi | Parodie des arcs classiques |
✅ Canon : Fait partie de l’histoire principale approuvée par Toriyama.
🔶 Semi-canon : Éléments partiellement intégrés (ex : Jaco explique des détails de Super).
❌ Non-canon : Œuvres dérivées sans impact sur la timeline officielle.
WordPress | Baskerville 2 by Anders Noren.