


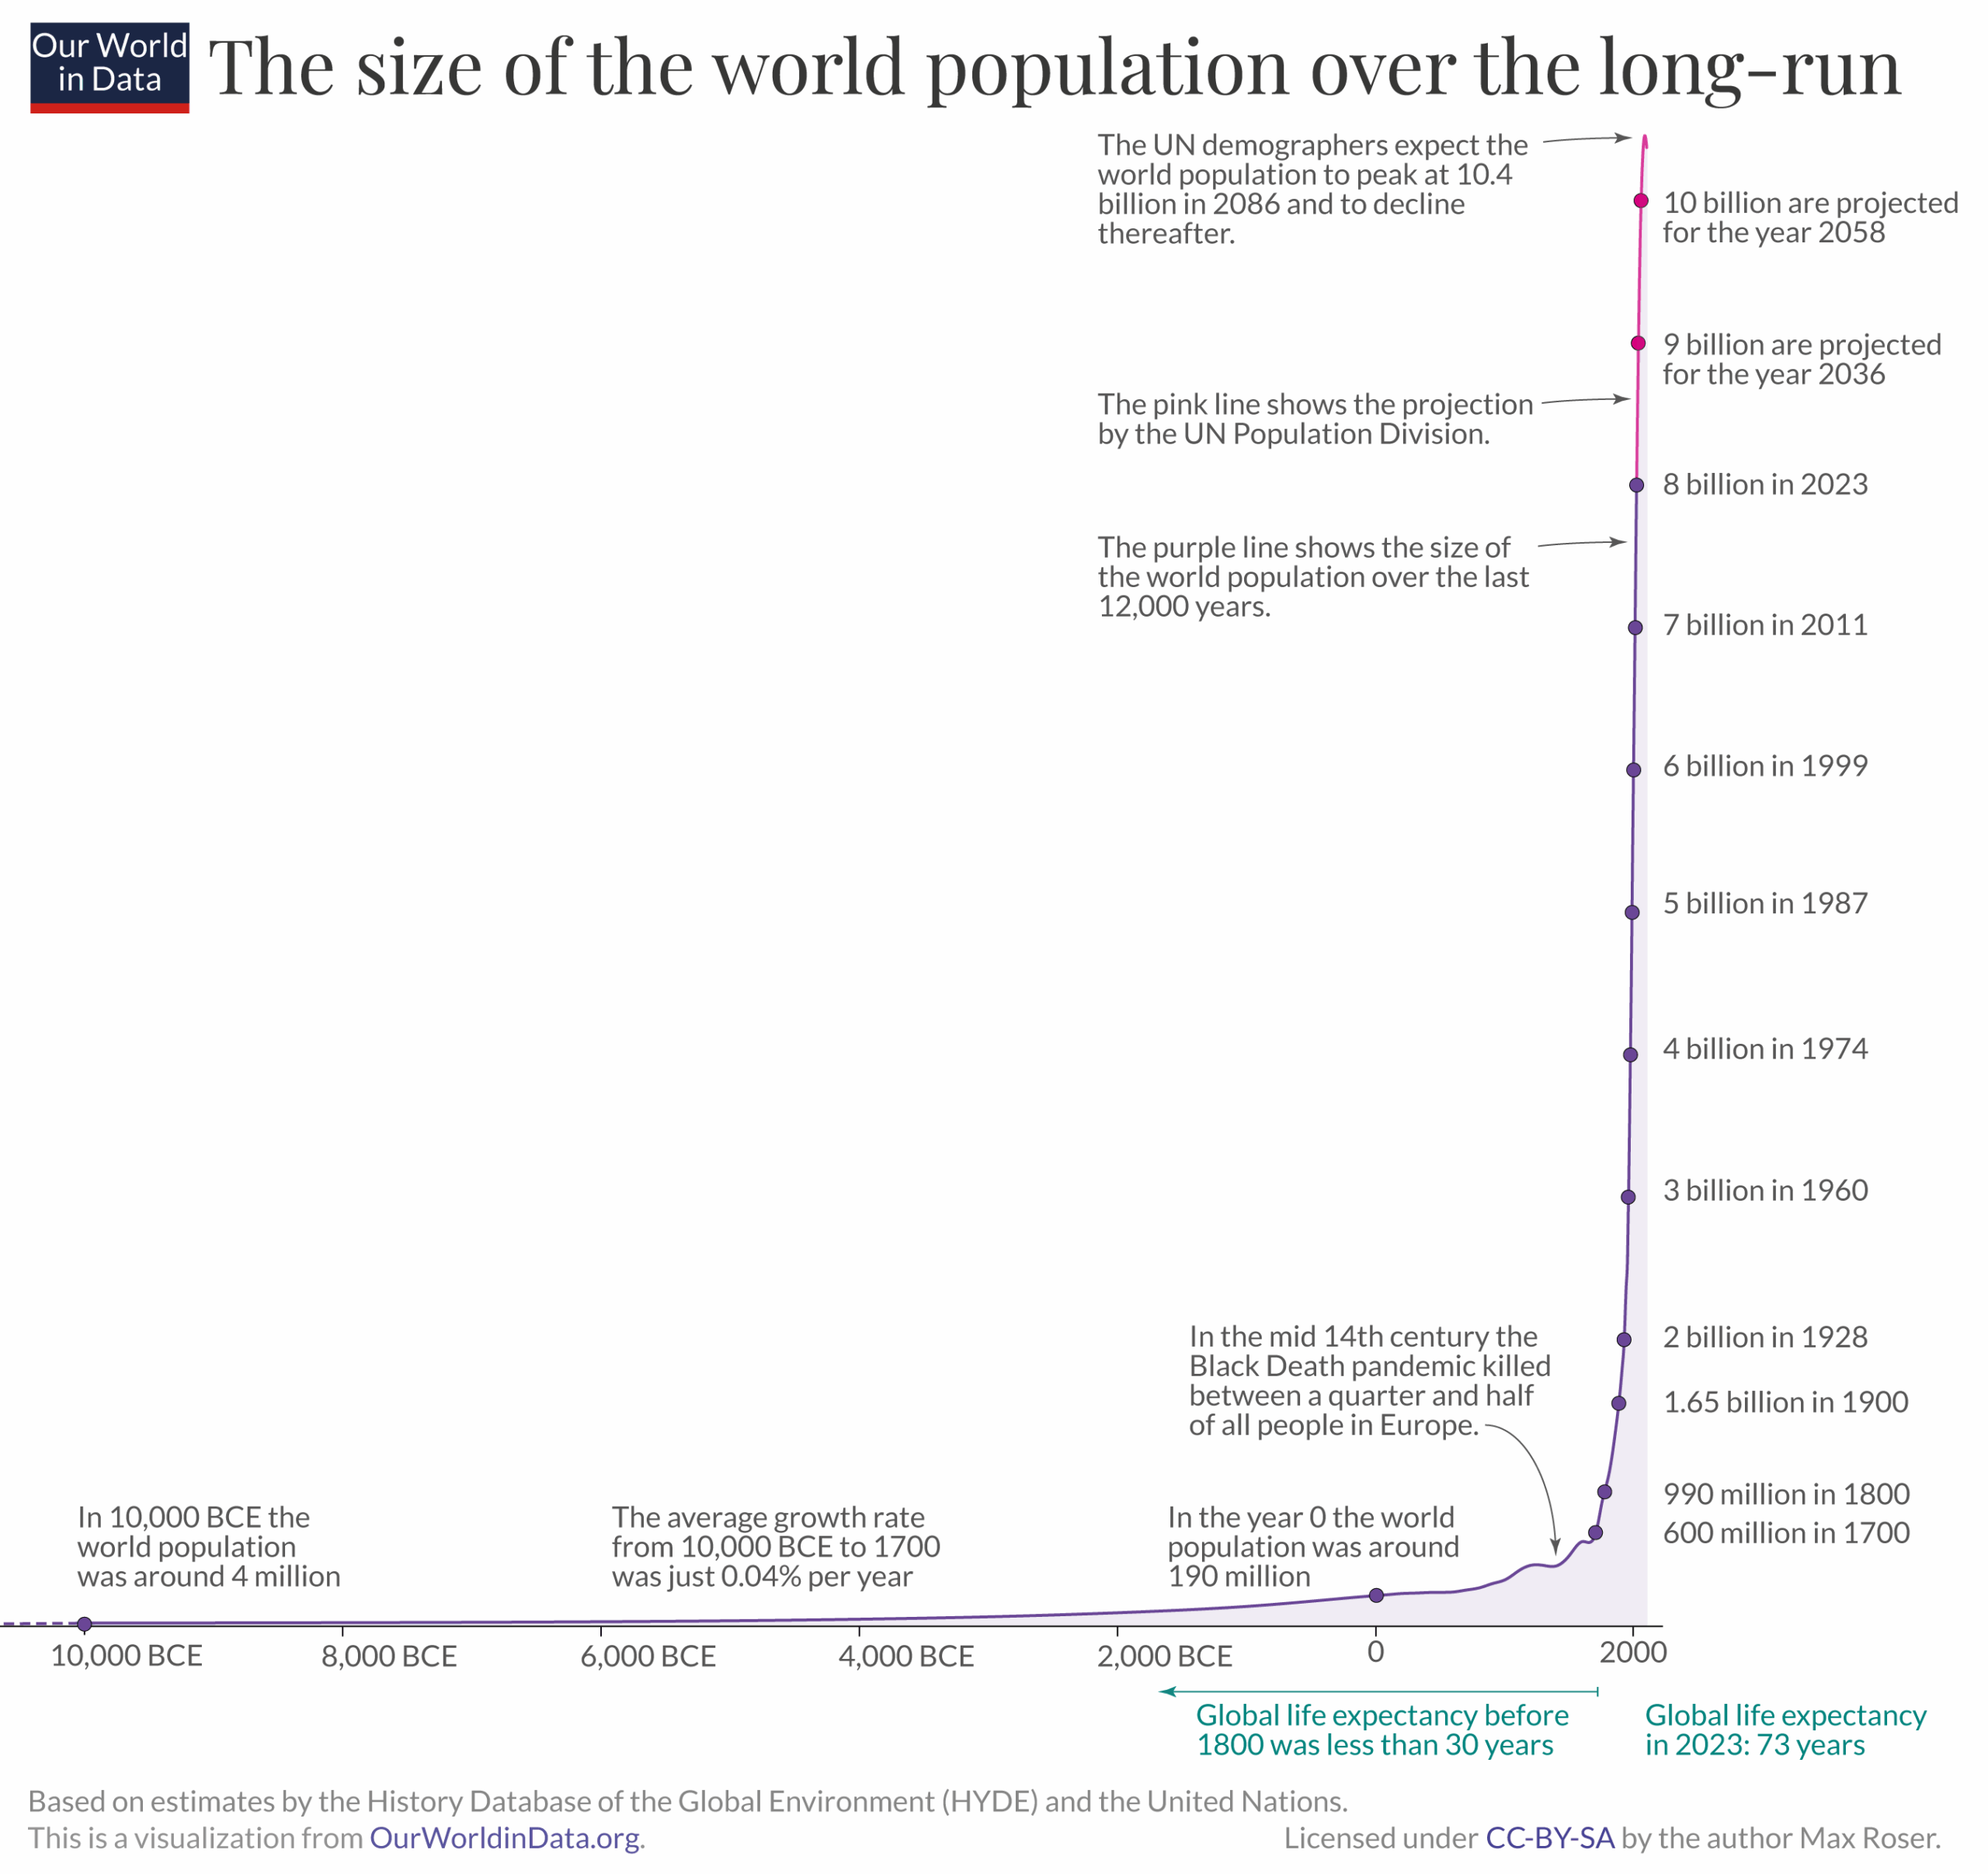
The world population has changed dramatically over the last few centuries. Let’s examine long-run population data to understand this change and how quickly the world’s population is growing today.
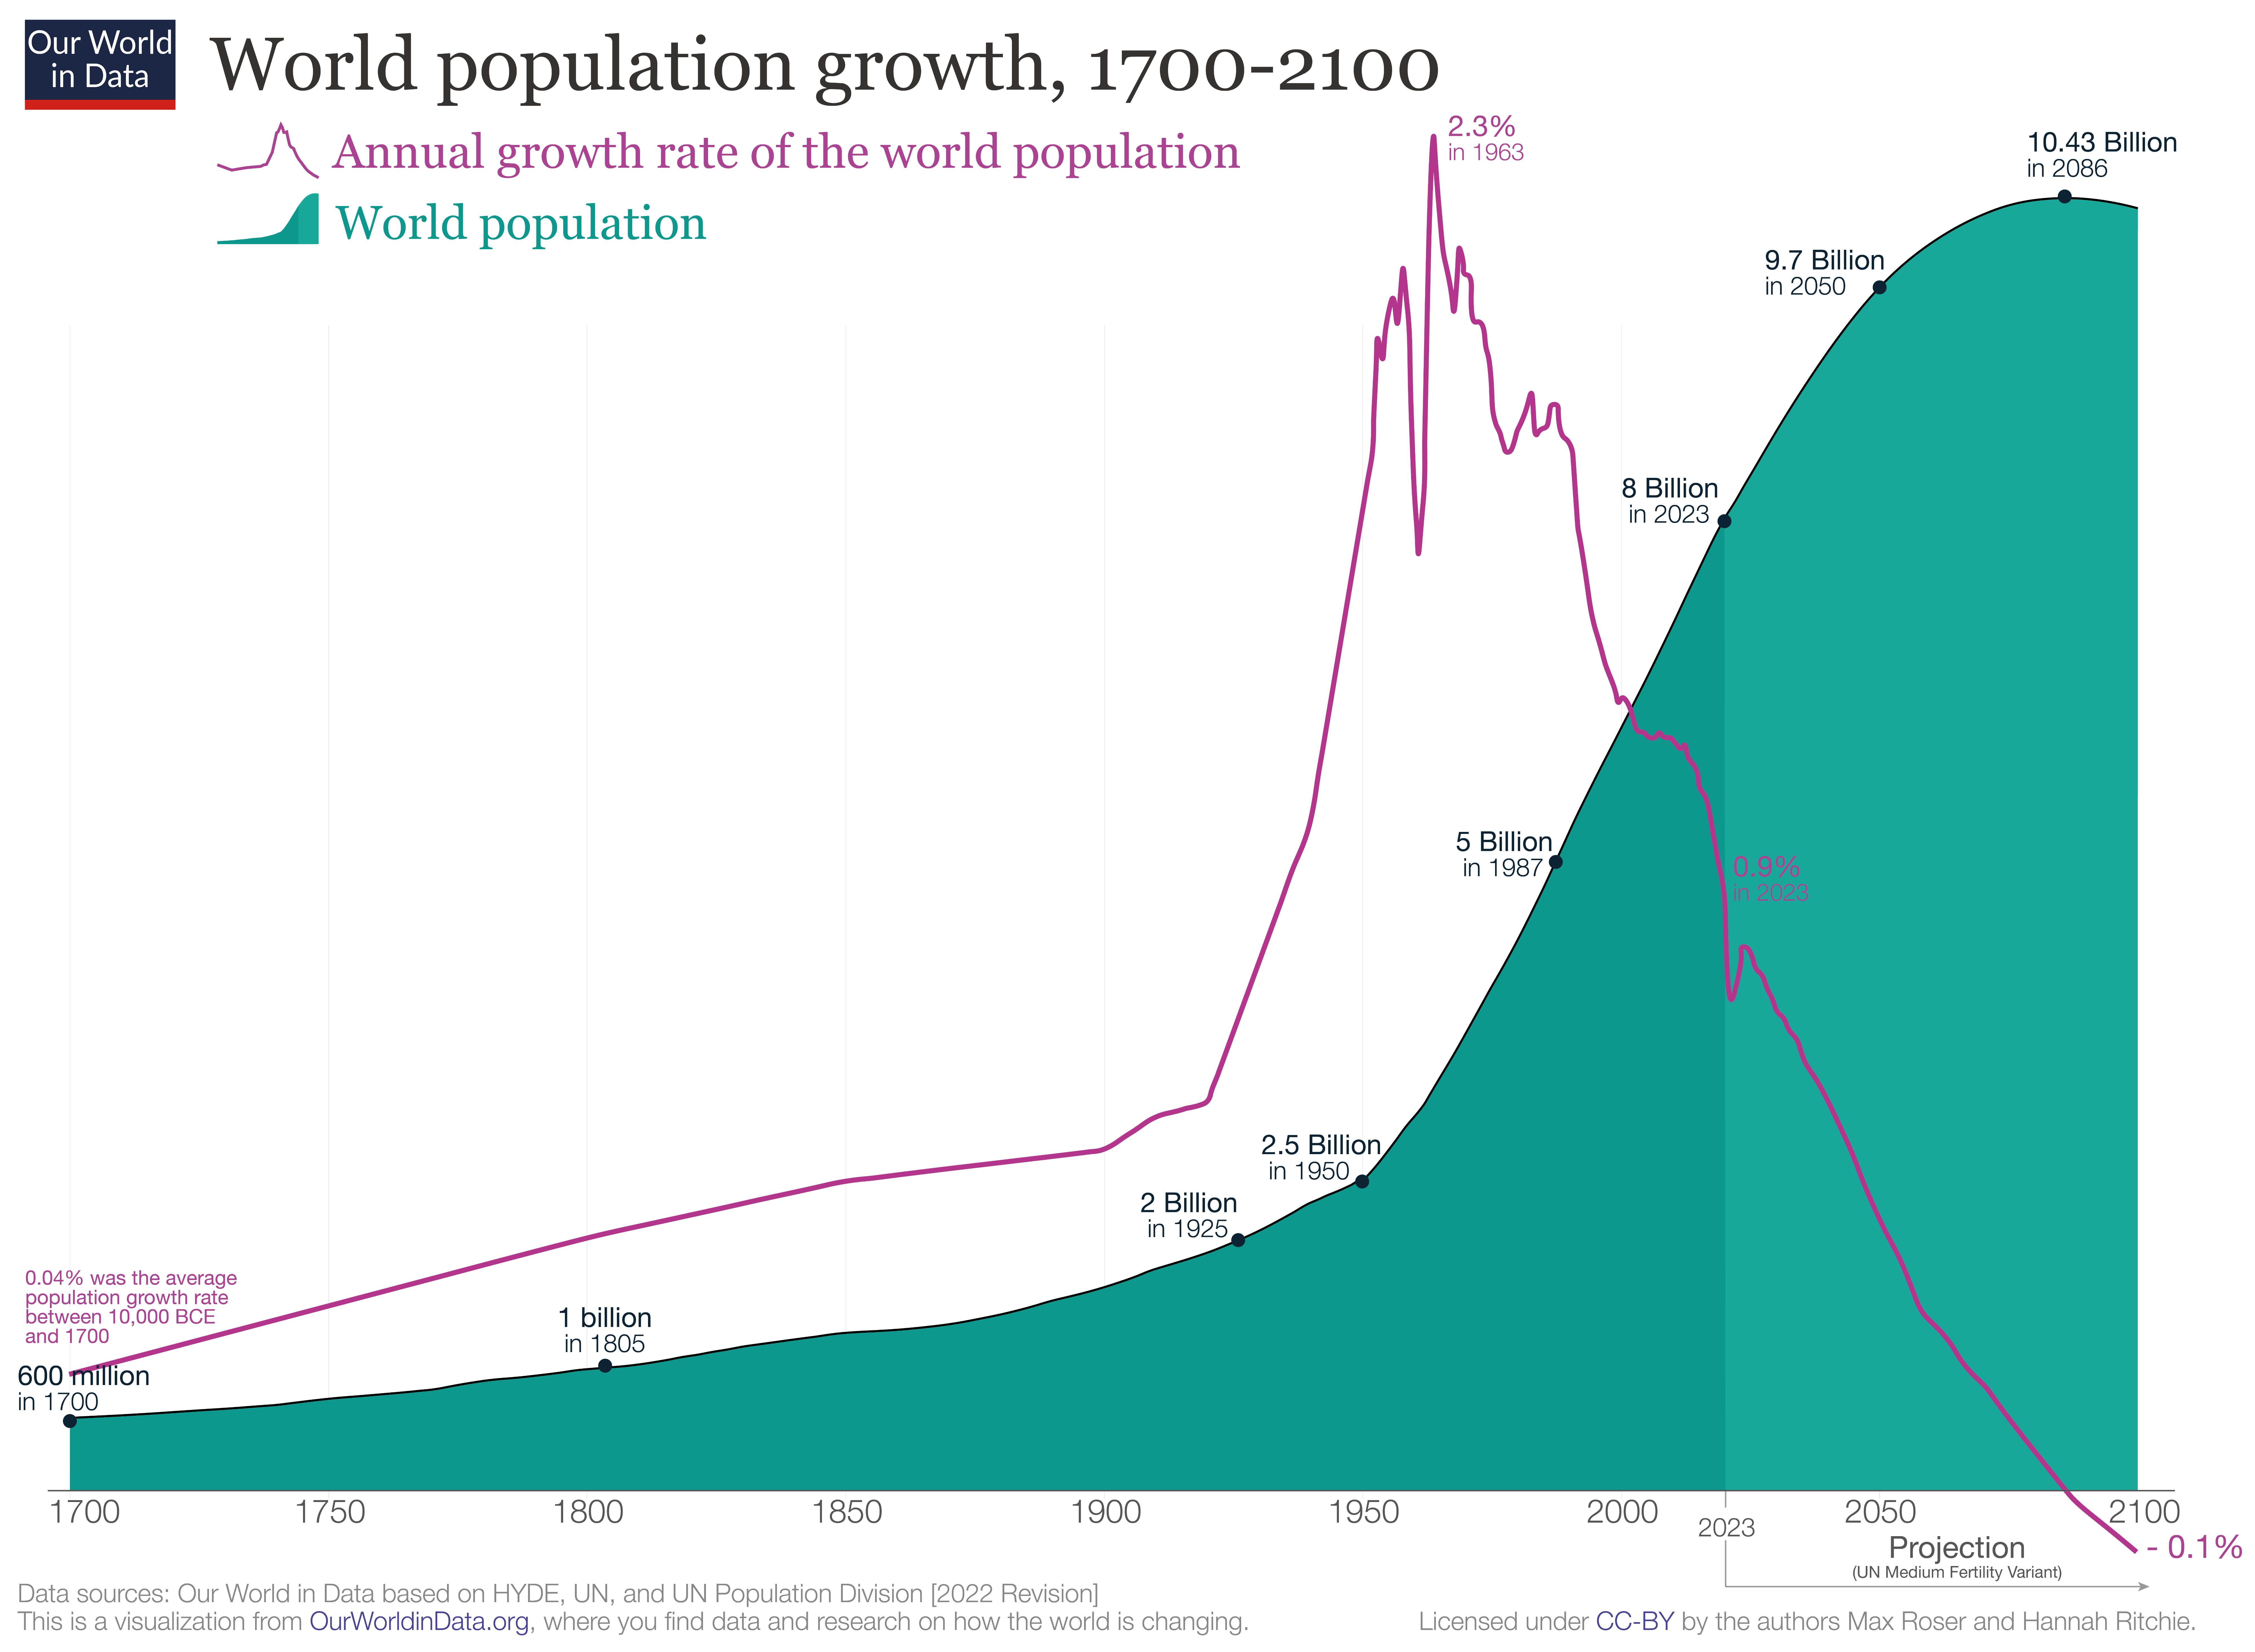
The global population growth rate peaked long ago. The chart shows that global population growth peaked in 1962 and 1963 with an annual growth rate of 2.2%; however, since then, world population growth has halved.
For the last half-century, the population growth rate has been declining. The UN projects that this decline will continue in the coming decades.
A common question we’re asked is: is the global population growing exponentially? The answer is no.
Population growth is determined by births and deaths. Every country has seen very substantial changes in both: mortality and fertility rates have fallen across the world.
However, declining mortality rates and declining fertility rates alone do not explain why populations grow. If these changes happened at the same time, the size of the population would not increase. What is crucial is the timing at which mortality and fertility change.
The model that explains why countries go through a period of rapid population growth is called the ‘demographic transition’. It is shown in the schematic figure. It is a beautifully simple model that describes the observed pattern in countries worldwide and is one of the great insights of demography.
Source 1: https://ourworldindata.org/population-growth-over-time
Source 2: https://ourworldindata.org/demographic-transition
CO2 emissions are typically measured on the basis of ‘production’. This accounting method – which is sometimes referred to as ‘territorial’ emissions – is used when countries report their emissions, and set targets domestically and internationally.
In addition to the commonly reported territorial emissions statisticians also calculate ‘consumption-based’ emissions. These emissions are adjusted for trade. To calculate consumption-based emissions we need to track which goods are traded across the world, and whenever a good was imported we need to include all CO2 emissions that were emitted in the production of that good, and vice versa to subtract all CO2 emissions that were emitted in the production of goods that were exported.
Consumption-based emissions reflect the consumption and lifestyle choices of a country’s citizens.
The following chart compare CO2 emissions with GDP per capita. As the GDP is based on the country production, this data compare territorial production (GDP) with territorial emissions, meaning the emissions produced within a country’s borders, but not those from imported goods. For example, emissions from imported steel are counted in the country where the steel is produced.
Source 1 : https://ourworldindata.org/consumption-based-co2
Source 2 : https://ourworldindata.org/grapher/co2-emissions-vs-gdp
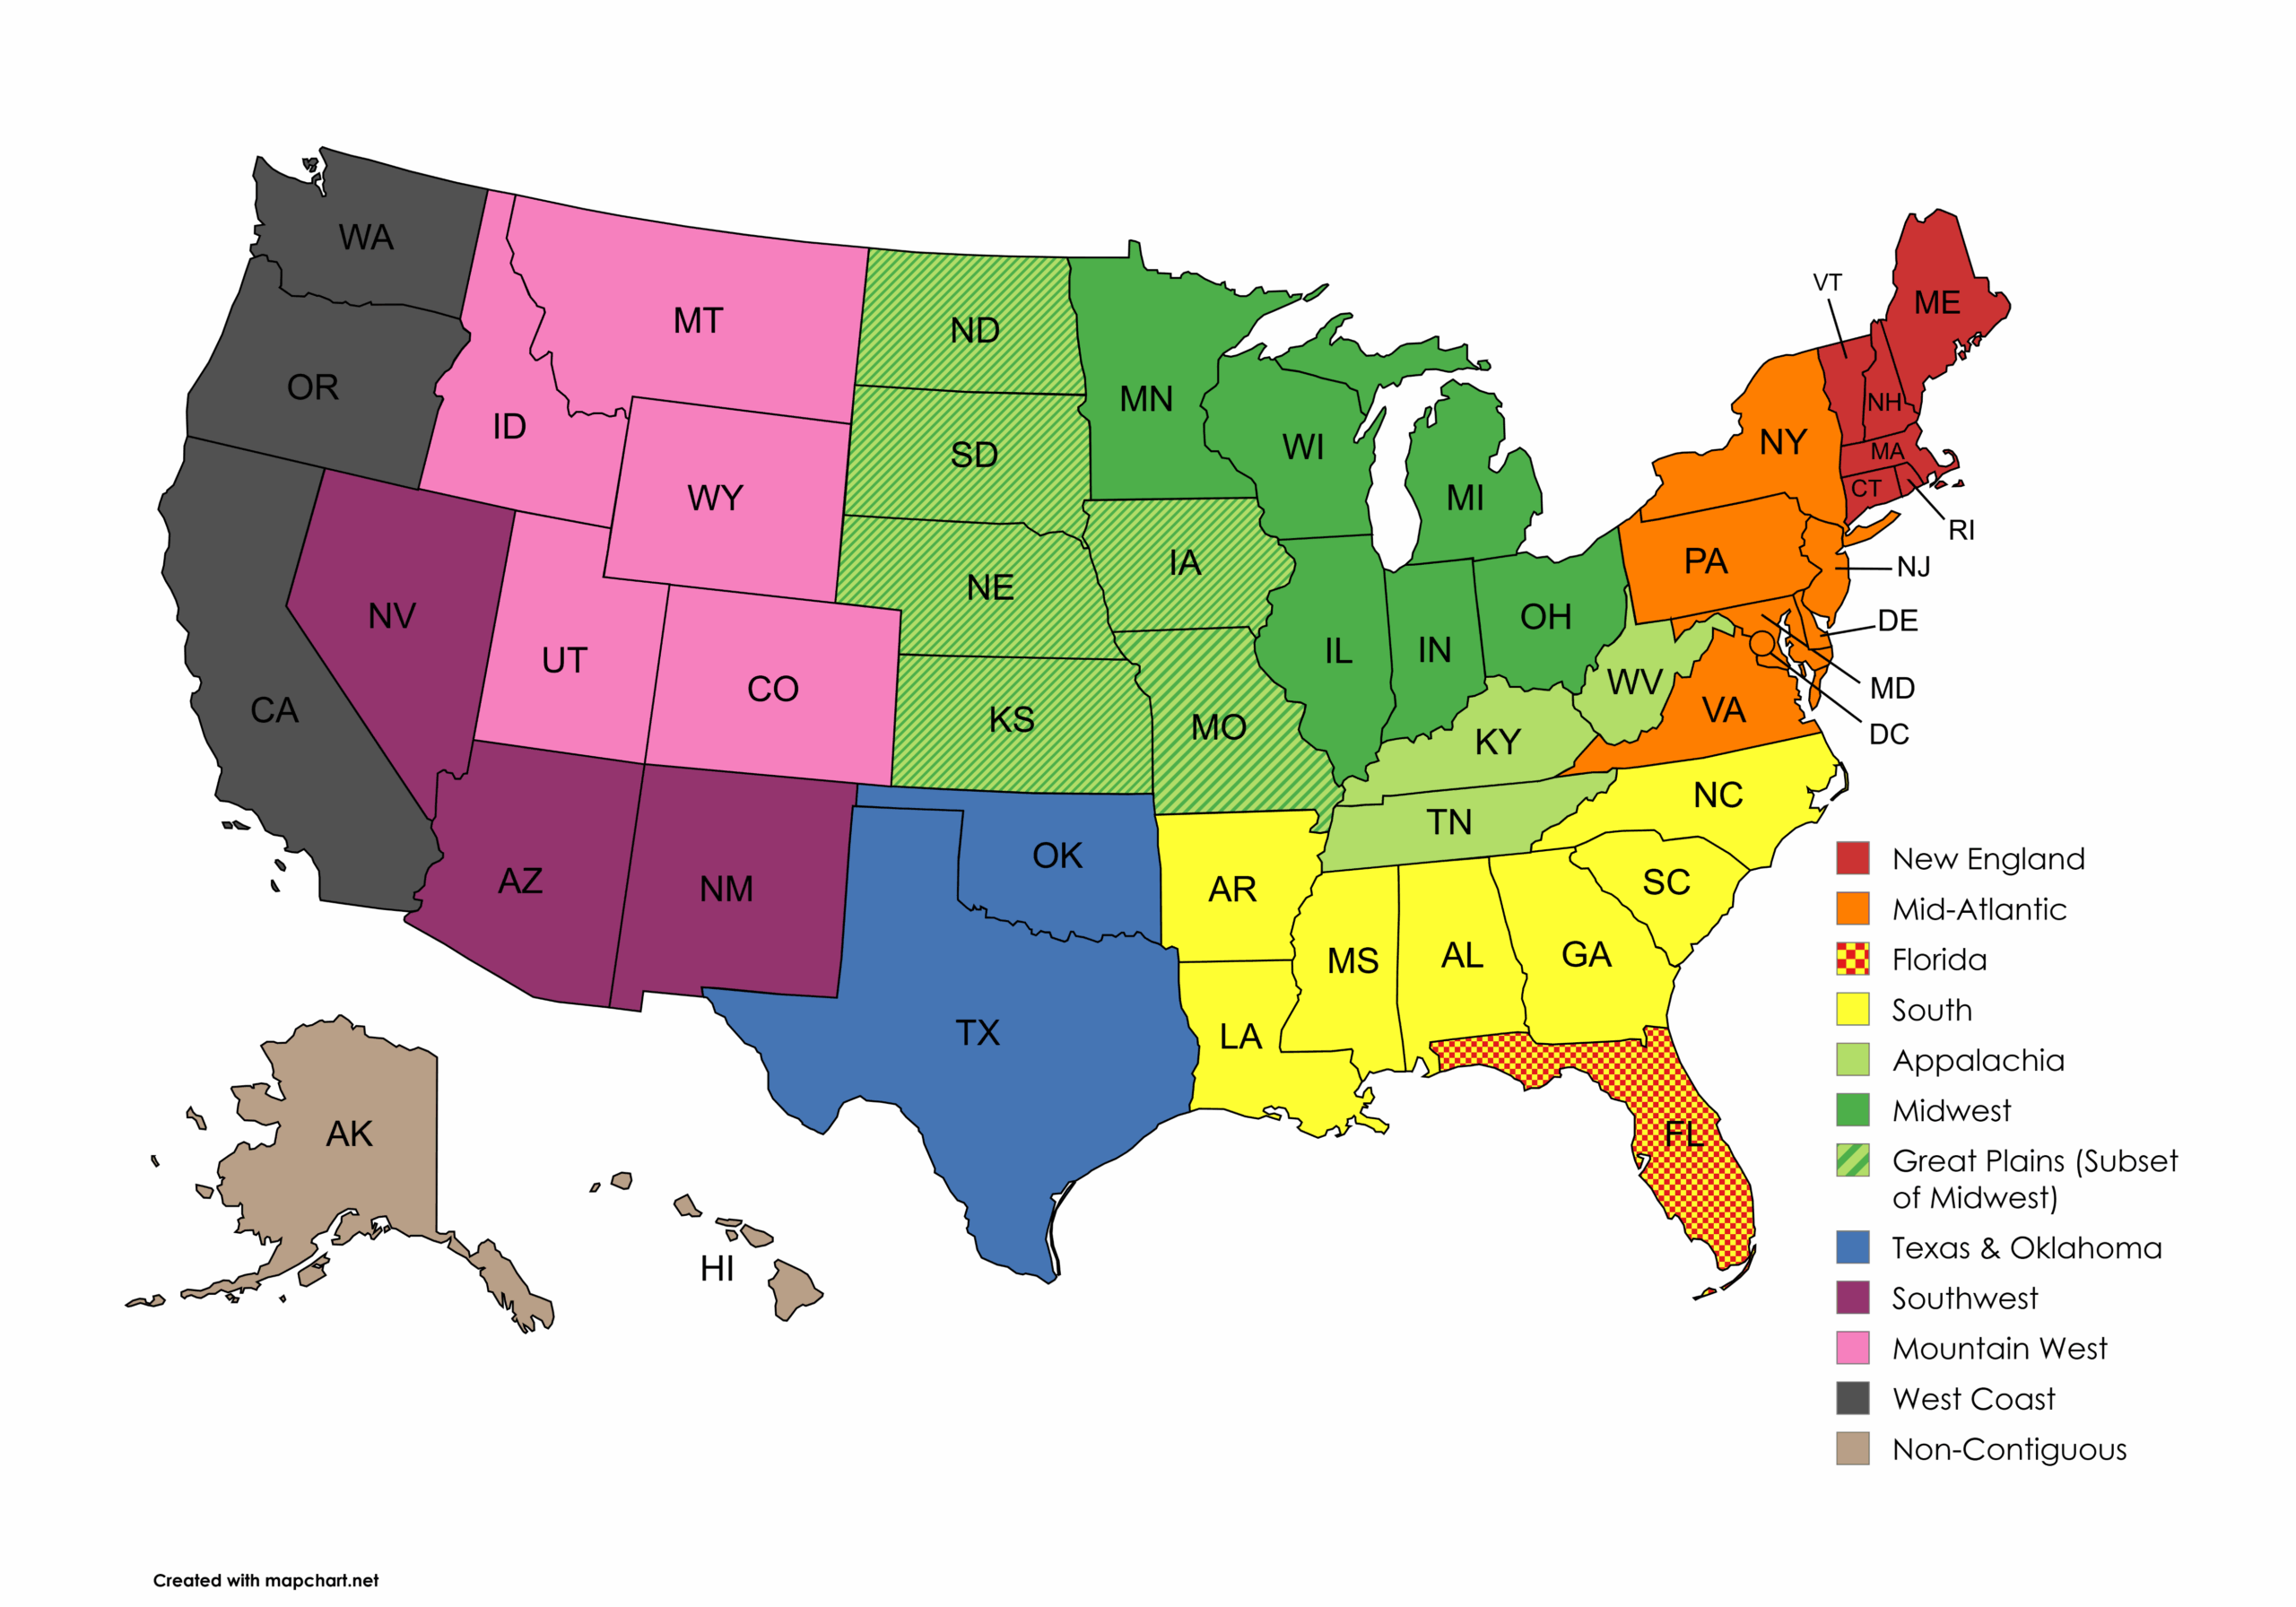
The classification of United States regions has sparked ongoing debate for decades. The challenge stems from a fundamental mismatch: geographic and cultural boundaries rarely align neatly with state lines. For truly accurate regional divisions, states would need to be subdivided—a Texas panhandle resident, after all, may have more in common with Oklahoma than with coastal Houston.
In practice, achieving consensus on regional definitions proves nearly impossible. Different organizations—from the Census Bureau to cultural geographers—draw the lines differently depending on their purposes. What follows is probably the most widely recognized approach to dividing America into regions.
Simulation d’ensoleillement sur 365 jours par an, permet de voir les opportunités d’économie d’énergie, planifier des améliorations et trouver les zones ensoleillées.
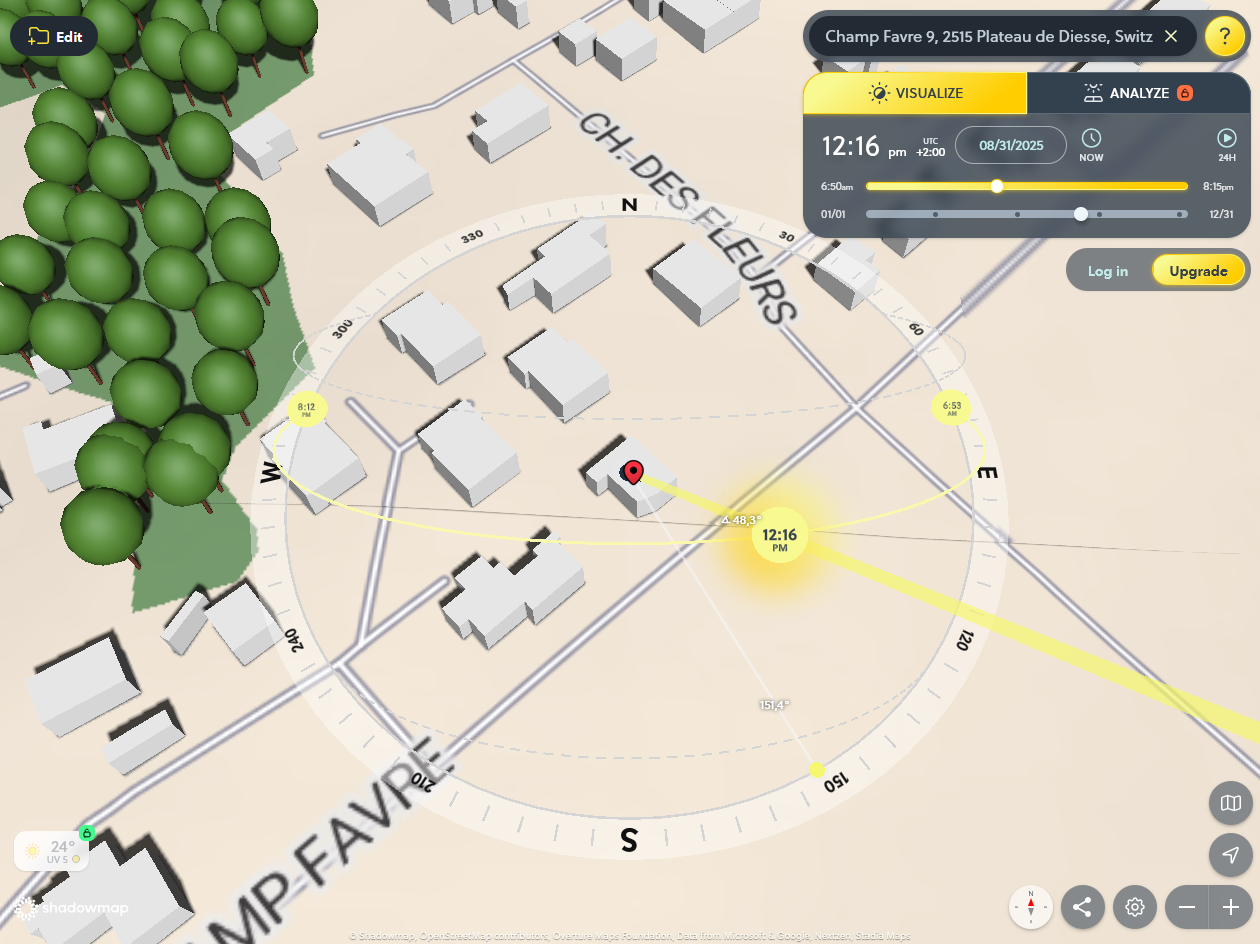
Permet de découvrir combien d’électricité et de chaleur votre toit peut produire, sur la base de l’ensoleillement annuel, détaillé par mois. Fonctionne aussi pour les façades. Site officiel suisse, ne couvrant que le territoire national.

Poor nutrition and illness in childhood limit human growth. As a consequence, the average height of a population is strongly correlated with living standards in a population. This makes the study of human height relevant for historians who want to understand the history of living conditions.
Because the effect of better material living standards is to make people taller, human height is used as an indirect measure of living standards. It is especially relevant for the study of living conditions in periods for which little or no other data is available — what historians refer to as the pre-statistical period.
It is important to stress that height is not used as a direct measure of well-being. The variation of height within a given population is largely determined by genetic factors.1
The history of human height allows us to track progress against undernourishment and disease and makes it possible to understand who started to benefit from modern advancements and when.
Source and more detailed information: https://ourworldindata.org/human-height
Isochrone maps visualize areas reachable within the same travel time from a starting point (e.g., “30 minutes by car from Geneva”).
Advanced tools allow you to:
• Combine multiple isochrones (e.g., overlap a 60-minute zone from Geneva and a 30-minute zone from Yverdon).
• Filter results to show only areas meeting all criteria.

Pre-Columbian civilizations refer to the societies and cultures that thrived in the Americas before the arrival of Christopher Columbus in 1492. These civilizations, including the Maya, Aztec, and Inca, developed advanced knowledge in architecture, astronomy, agriculture, and governance, leaving a lasting impact on history despite their decline following European colonization.
Source: Britannica


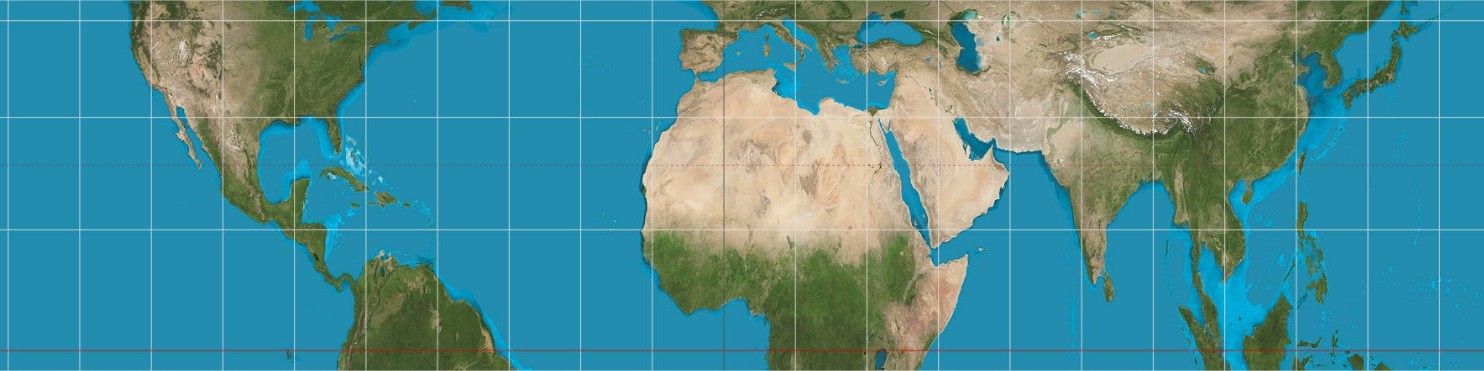
Many projections of the globe have been published over the centuries, despite the mathematical impossibility of a rectangular projection. There is then a heated debate about which is the most accurate. Impossible question of course as it depends on which parameter you value the most: angles, areas or distances. There is no way to be accurate on one parameter without changing another incorrectly.
Here are some pages to help to better understand the differences between the different projections available:


Source: EmpororTigerstar
Source: Cottereau
Source: Ollie Bye

On the heels of the History channel special that explored what Earth might be like if the human race were suddenly to disappear comes a series that provides, in even-more detail, a picture of a post-human future, revealing the fate of structures like the Sears Tower and the Sistine Chapel and creatures that might inherit the places we once lived. Supporting the visuals and special effects are interviews with specialists from the fields of engineering, botany, biology, geology and archaeology.

WordPress | Baskerville 2 by Anders Noren.