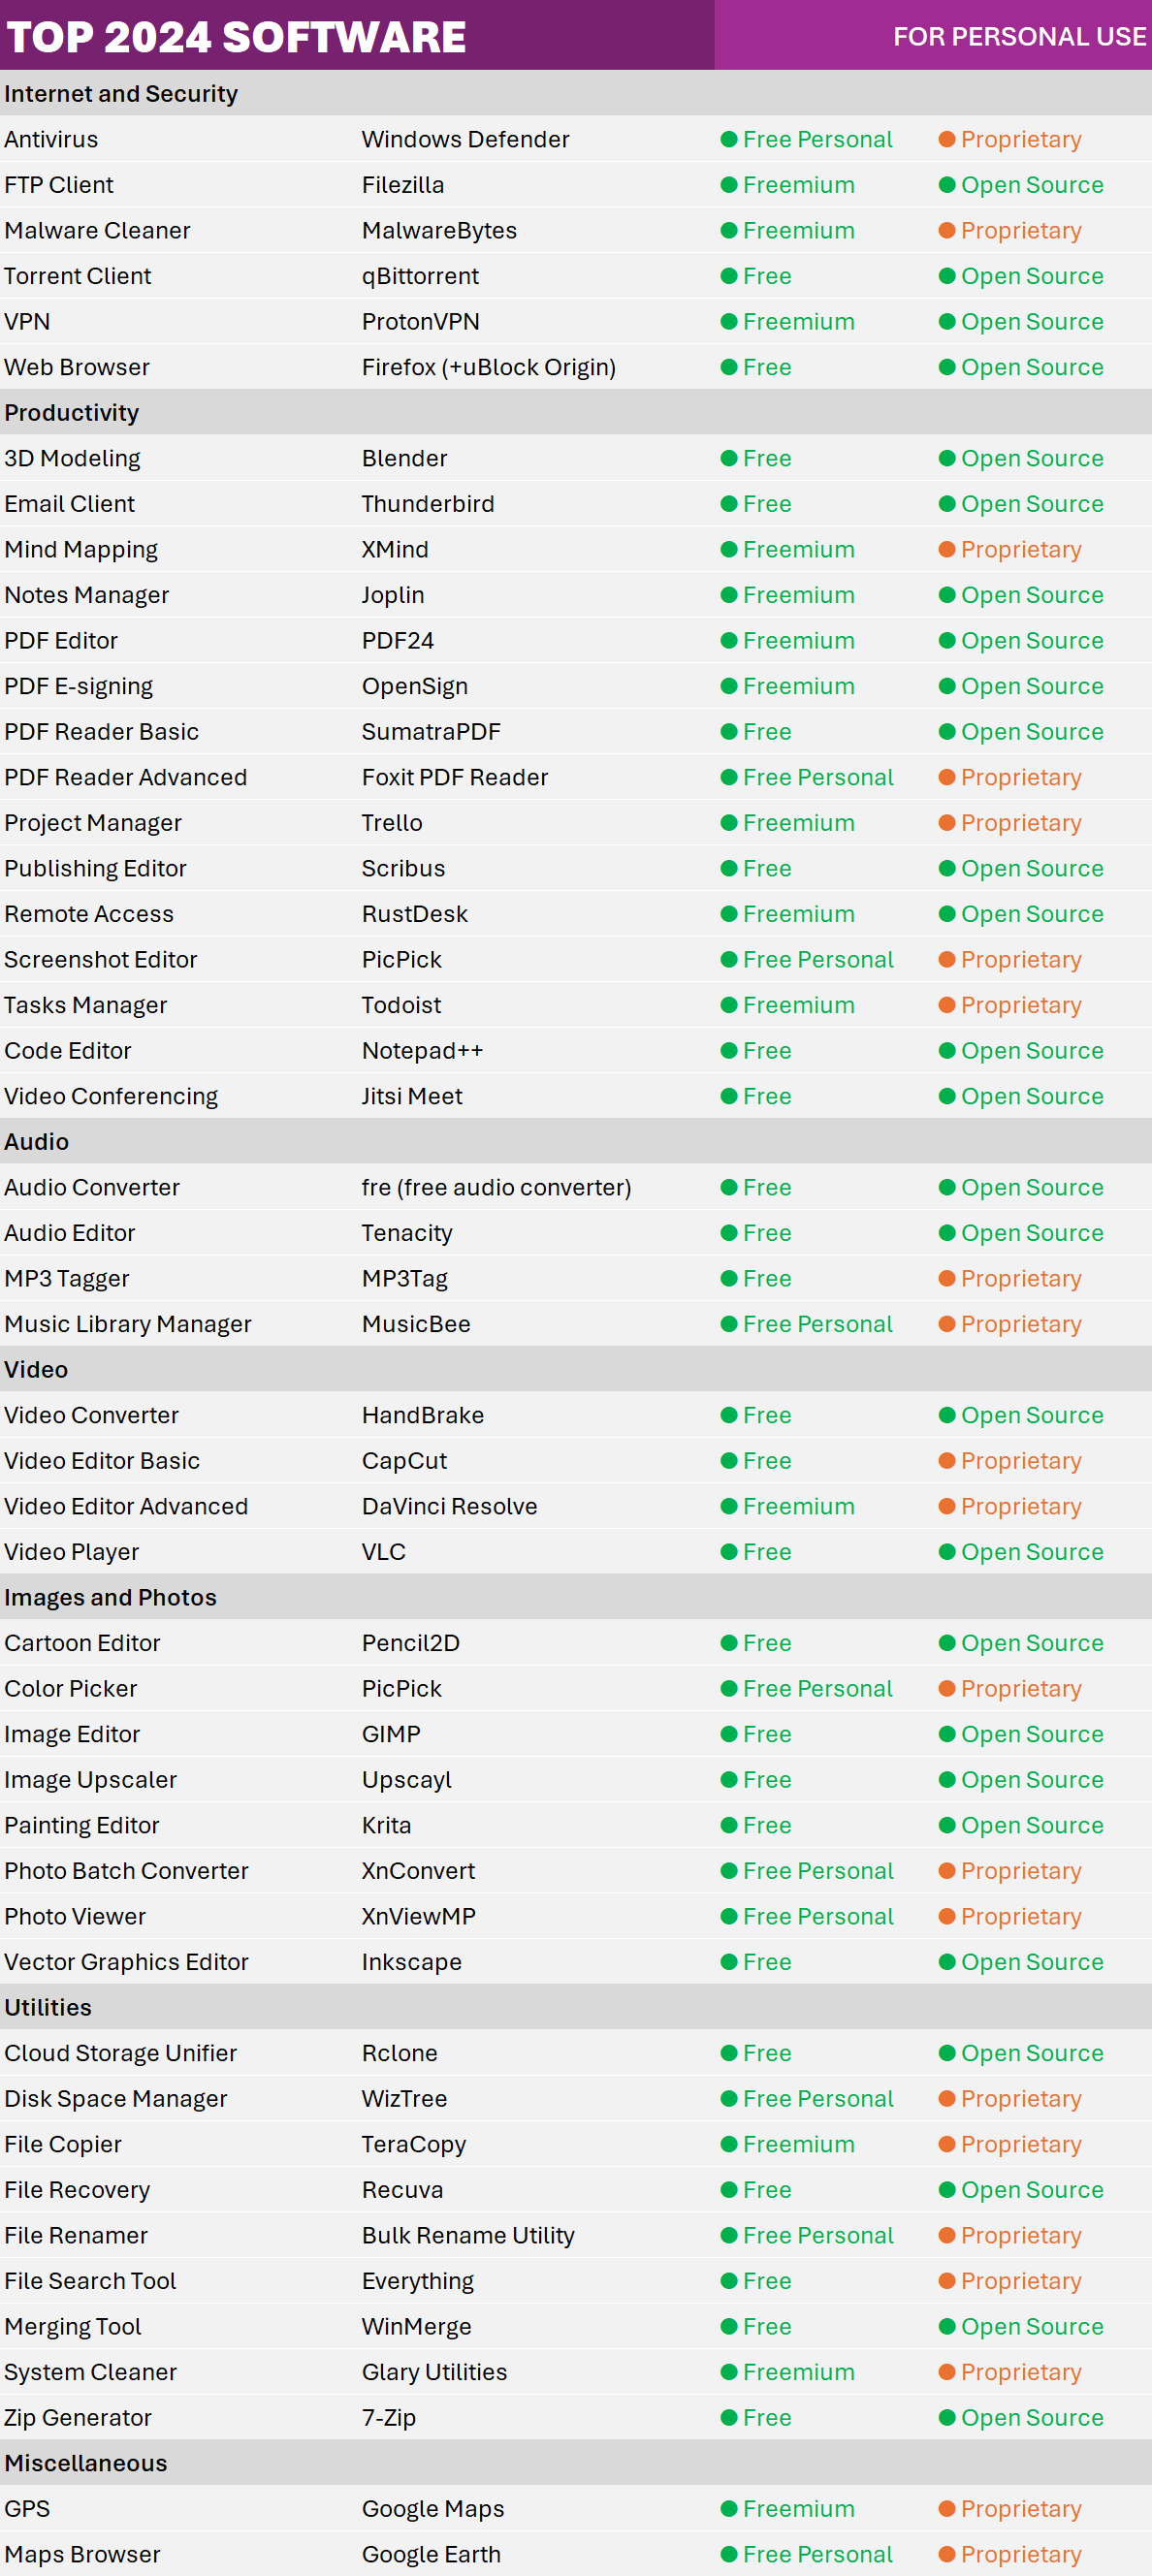
Best Free Software 2025 | For Personal Use
CO2 emissions are typically measured on the basis of ‘production’. This accounting method – which is sometimes referred to as ‘territorial’ emissions – is used when countries report their emissions, and set targets domestically and internationally.
In addition to the commonly reported territorial emissions statisticians also calculate ‘consumption-based’ emissions. These emissions are adjusted for trade. To calculate consumption-based emissions we need to track which goods are traded across the world, and whenever a good was imported we need to include all CO2 emissions that were emitted in the production of that good, and vice versa to subtract all CO2 emissions that were emitted in the production of goods that were exported.
Consumption-based emissions reflect the consumption and lifestyle choices of a country’s citizens.
The following chart compare CO2 emissions with GDP per capita. As the GDP is based on the country production, this data compare territorial production (GDP) with territorial emissions, meaning the emissions produced within a country’s borders, but not those from imported goods. For example, emissions from imported steel are counted in the country where the steel is produced.
Source 1 : https://ourworldindata.org/consumption-based-co2
Source 2 : https://ourworldindata.org/grapher/co2-emissions-vs-gdp
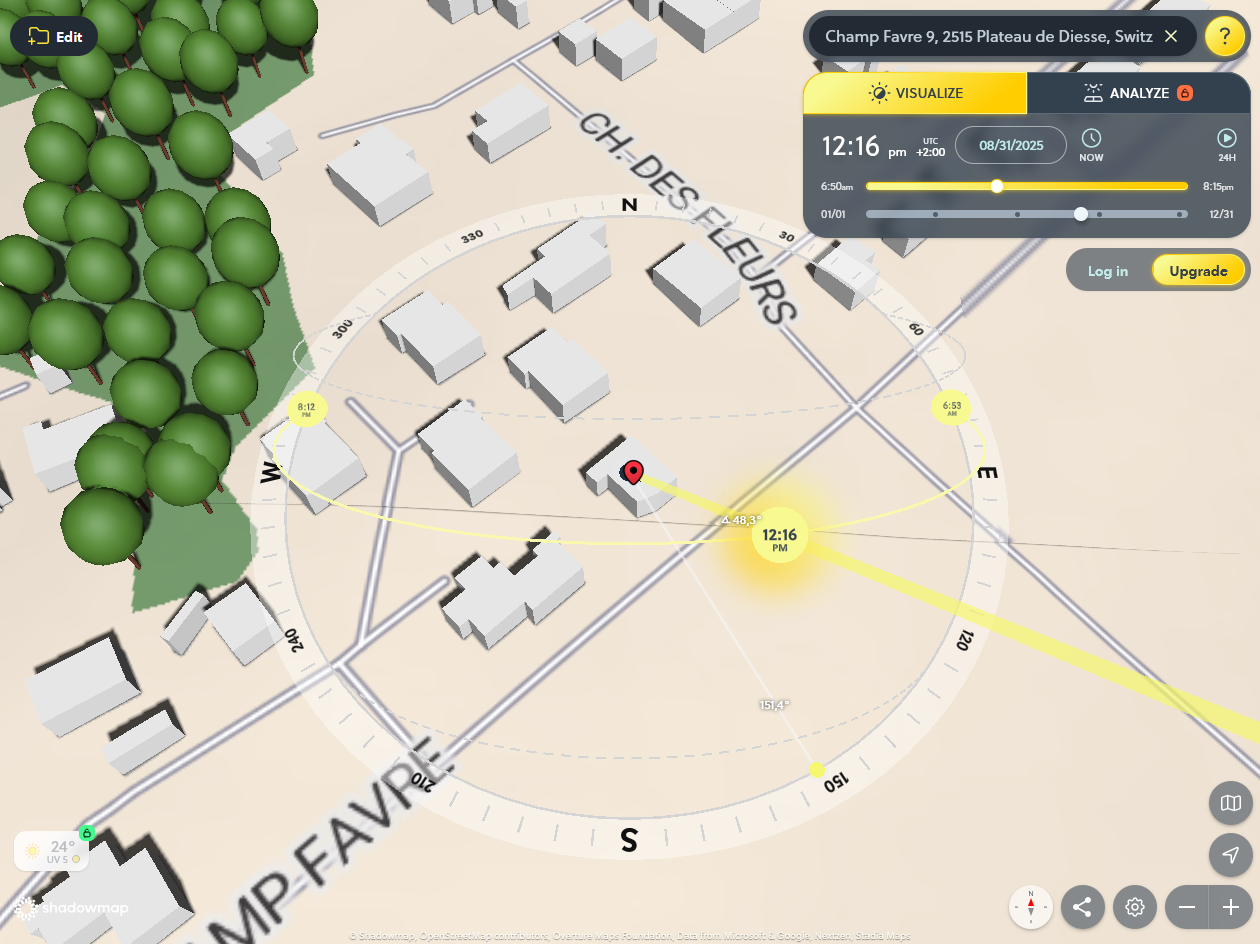
Simulation d’ensoleillement sur 365 jours par an, permet de voir les opportunités d’économie d’énergie, planifier des améliorations et trouver les zones ensoleillées.
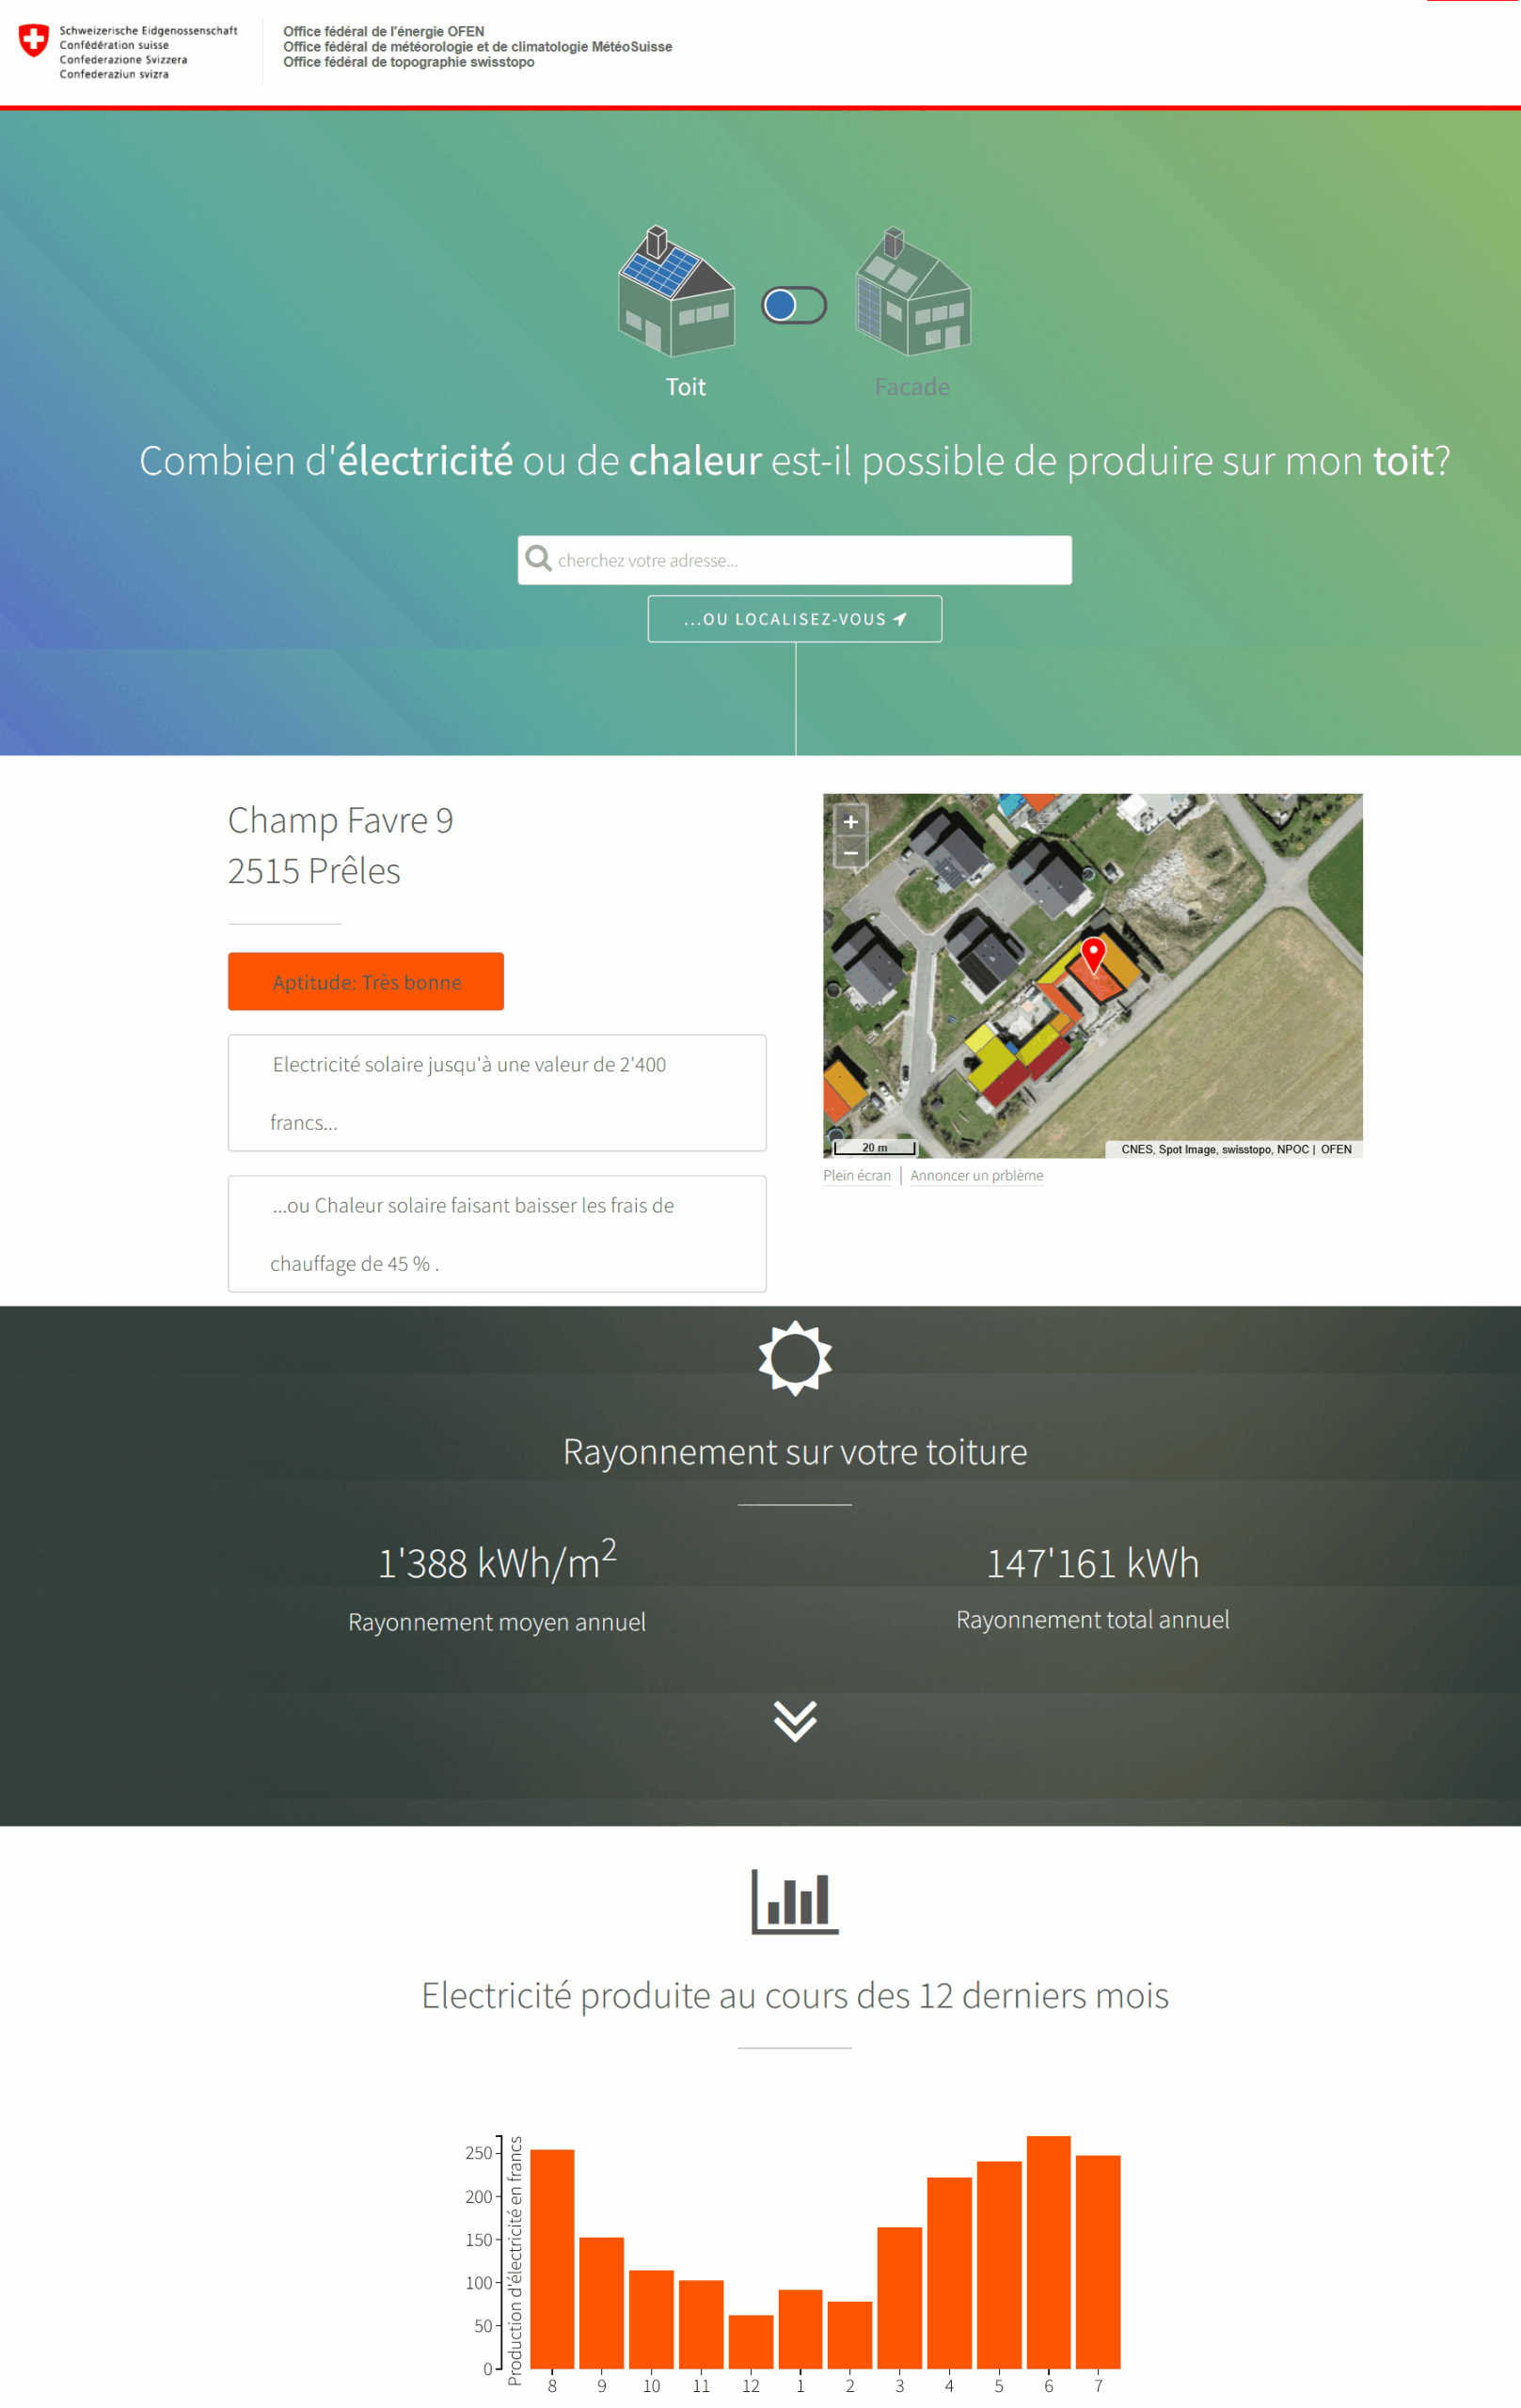
Permet de découvrir combien d’électricité et de chaleur votre toit peut produire, sur la base de l’ensoleillement annuel, détaillé par mois. Fonctionne aussi pour les façades. Site officiel suisse, ne couvrant que le territoire national.
Poor nutrition and illness in childhood limit human growth. As a consequence, the average height of a population is strongly correlated with living standards in a population. This makes the study of human height relevant for historians who want to understand the history of living conditions.
Because the effect of better material living standards is to make people taller, human height is used as an indirect measure of living standards. It is especially relevant for the study of living conditions in periods for which little or no other data is available — what historians refer to as the pre-statistical period.
It is important to stress that height is not used as a direct measure of well-being. The variation of height within a given population is largely determined by genetic factors.1
The history of human height allows us to track progress against undernourishment and disease and makes it possible to understand who started to benefit from modern advancements and when.
Source and more detailed information: https://ourworldindata.org/human-height
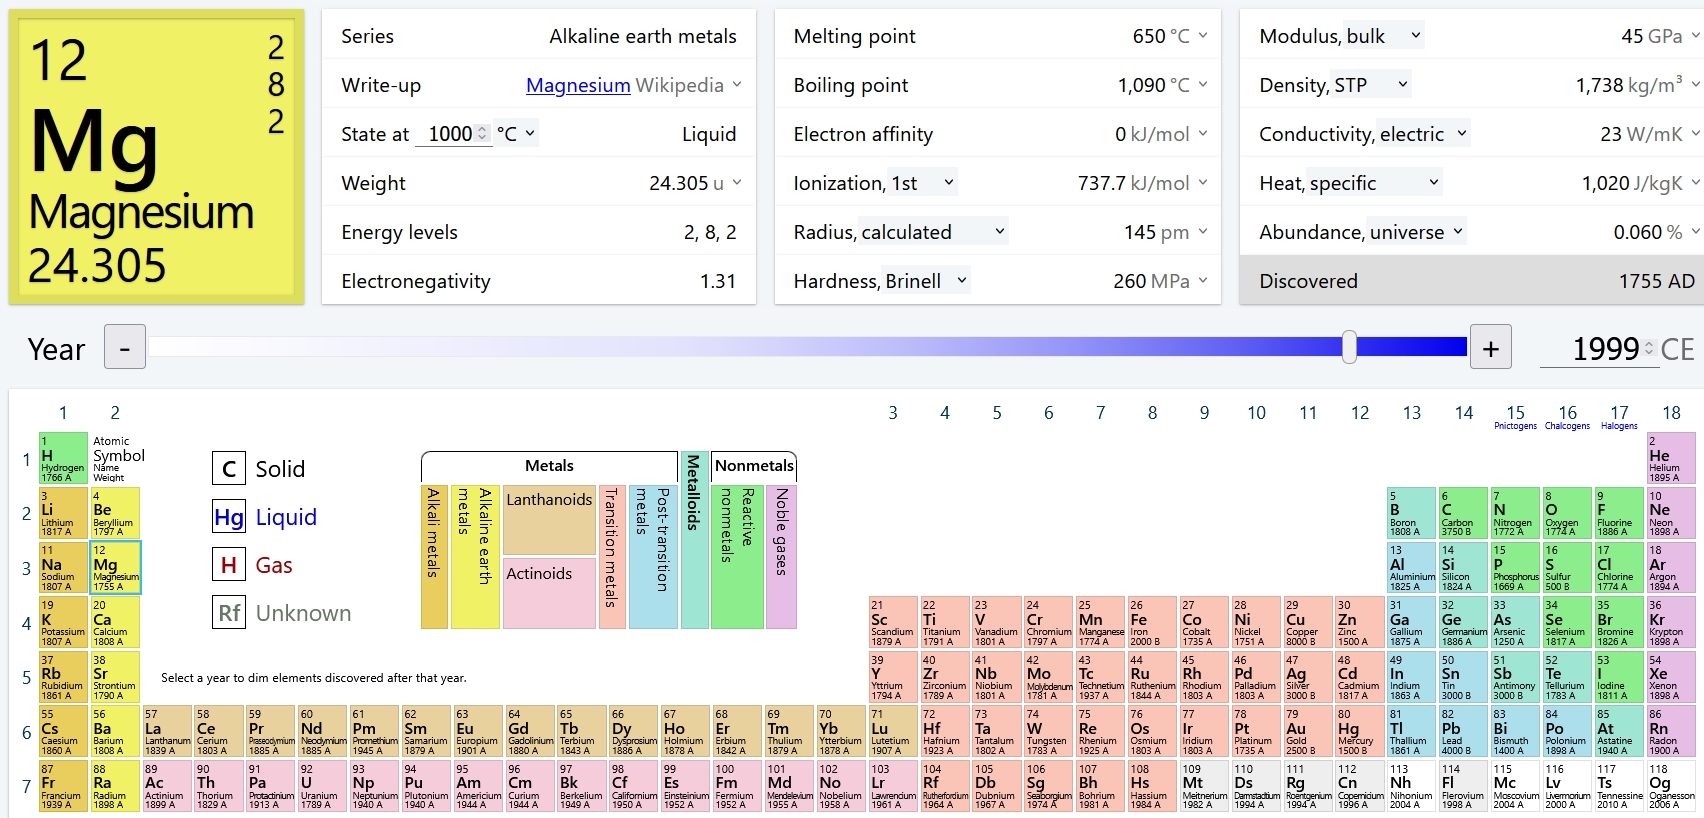
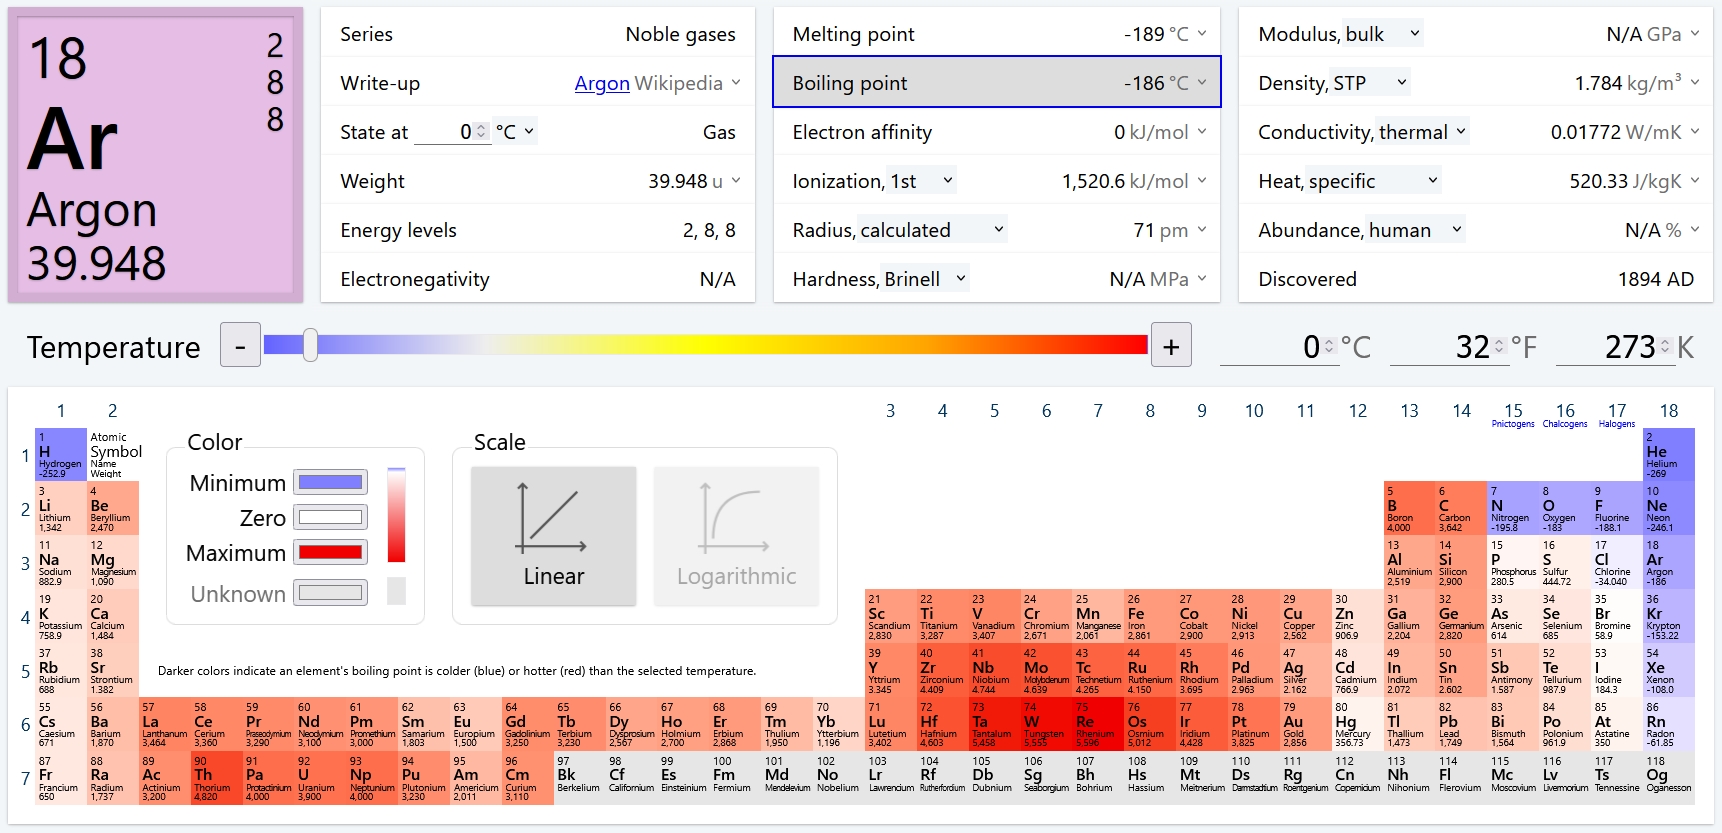
Ptable.com is a dynamic, web-based periodic table of elements that offers a powerful and intuitive interface for students, educators, and professionals alike. Unlike traditional printed tables, Ptable updates in real-time and integrates data-rich content like element properties, isotopes, and historical data, all presented in a highly interactive and user-friendly format.
Notable features:
• Instant data access – Hover over or click any element to see detailed information including properties, electron configurations, and oxidation states.
• Multiple views – Switch between physical, atomic, orbital, and isotopic views to suit your learning or research needs.
• Multilingual support – Available in dozens of languages, making it accessible to a global audience.
• Real-time updates – Constantly maintained with up-to-date scientific information.
• Mobile-friendly – Works smoothly across devices without needing to install anything.
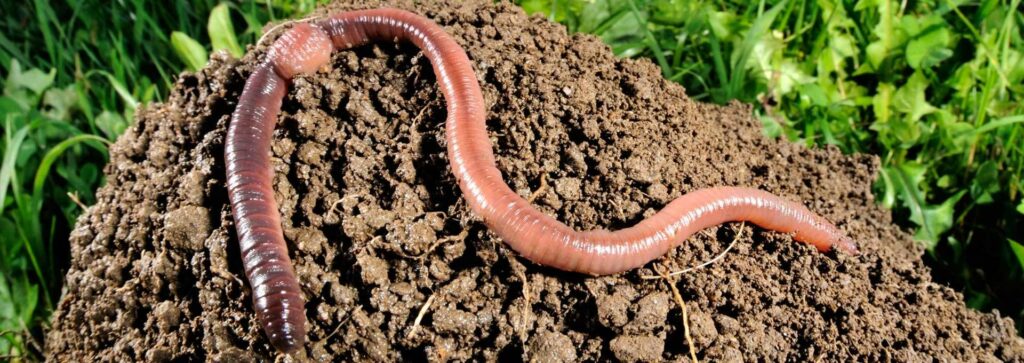
Les vers de terre constituent la moitié de la biomasse animale terrestre.
1. Le poids écrasant des vers de terre
Un monopole inattendu
Selon une étude publiée dans PNAS (2018, voir source en bas de ce post), les vers de terre représentent environ 1,2 milliard de tonnes métriques, soit 50% de la biomasse animale terrestre totale.
En comparaison (voir tableau plus bas) :
• Le bétail domestique (vaches, porcs, moutons) pèse 600 millions de tonnes (25%).
• Les humains atteignent 60 millions de tonnes (2,5%).
• Tous les mammifères sauvages (éléphants, loups, cerfs) ne totalisent que 20 millions de tonnes (0,8%).
Cette domination s’explique par leur densité phénoménale : dans une prairie fertile, on peut trouver jusqu’à 1 million de vers par hectare, pesant collectivement 1 à 3 tonnes.
Pourquoi une telle abondance ?
• Une adaptation parfaite : Présents sur tous les continents (sauf déserts et glaciers).
• Un cycle de vie rapide : Certaines espèces produisent 100 œufs par an.
• Peu de prédateurs directs : Les taupes et oiseaux en mangent, mais pas assez pour limiter leur expansion.


WordPress | Baskerville 2 by Anders Noren.